Characterise how the flat-field (light) transmission through the stepped-height microfluidic channel evolves at three key points during the 2026-07-16 urea-assay experiment, and identify which flat-field image set should be used to normalise each group of concentration measurements.
The channel is a DLP-3D-printed dense PEGDA network (Mn = 250 Da) bonded to a glass substrate, imaged on an inverted Olympus IX71 (4× objective + 1.6× magnification, TRITC bandpass filter ~530–590 nm, 0.925 µm/px). Eight stepped-height sections (200 → 30 µm) span the field of view.
| Step | Directory | Clock | Purpose |
|---|---|---|---|
| Prime + focus | — | — | Buffer, focus, secure platform |
| T1 | light |
15:02 | 30-frame flat-field burst before any dye |
| Dark | dark |
— | Dark correction frames |
| BTB dye | bromothymol blue |
15:05 | 0.5 % bromothymol blue fill + image |
| T2 | post-blue light |
15:08 | 30-frame flat-field after BTB flush |
| Old concentrations | old concentrations/ |
15:10–15:33 | 13 urea samples (0–20 mM) |
| T3 | light in-between sets |
15:36 | 30-frame flat-field after old-conc. runs |
| New concentrations | new concentrations/ |
15:38–16:00 | 13 urea samples (0–20 mM) repeated |
Questions addressed:
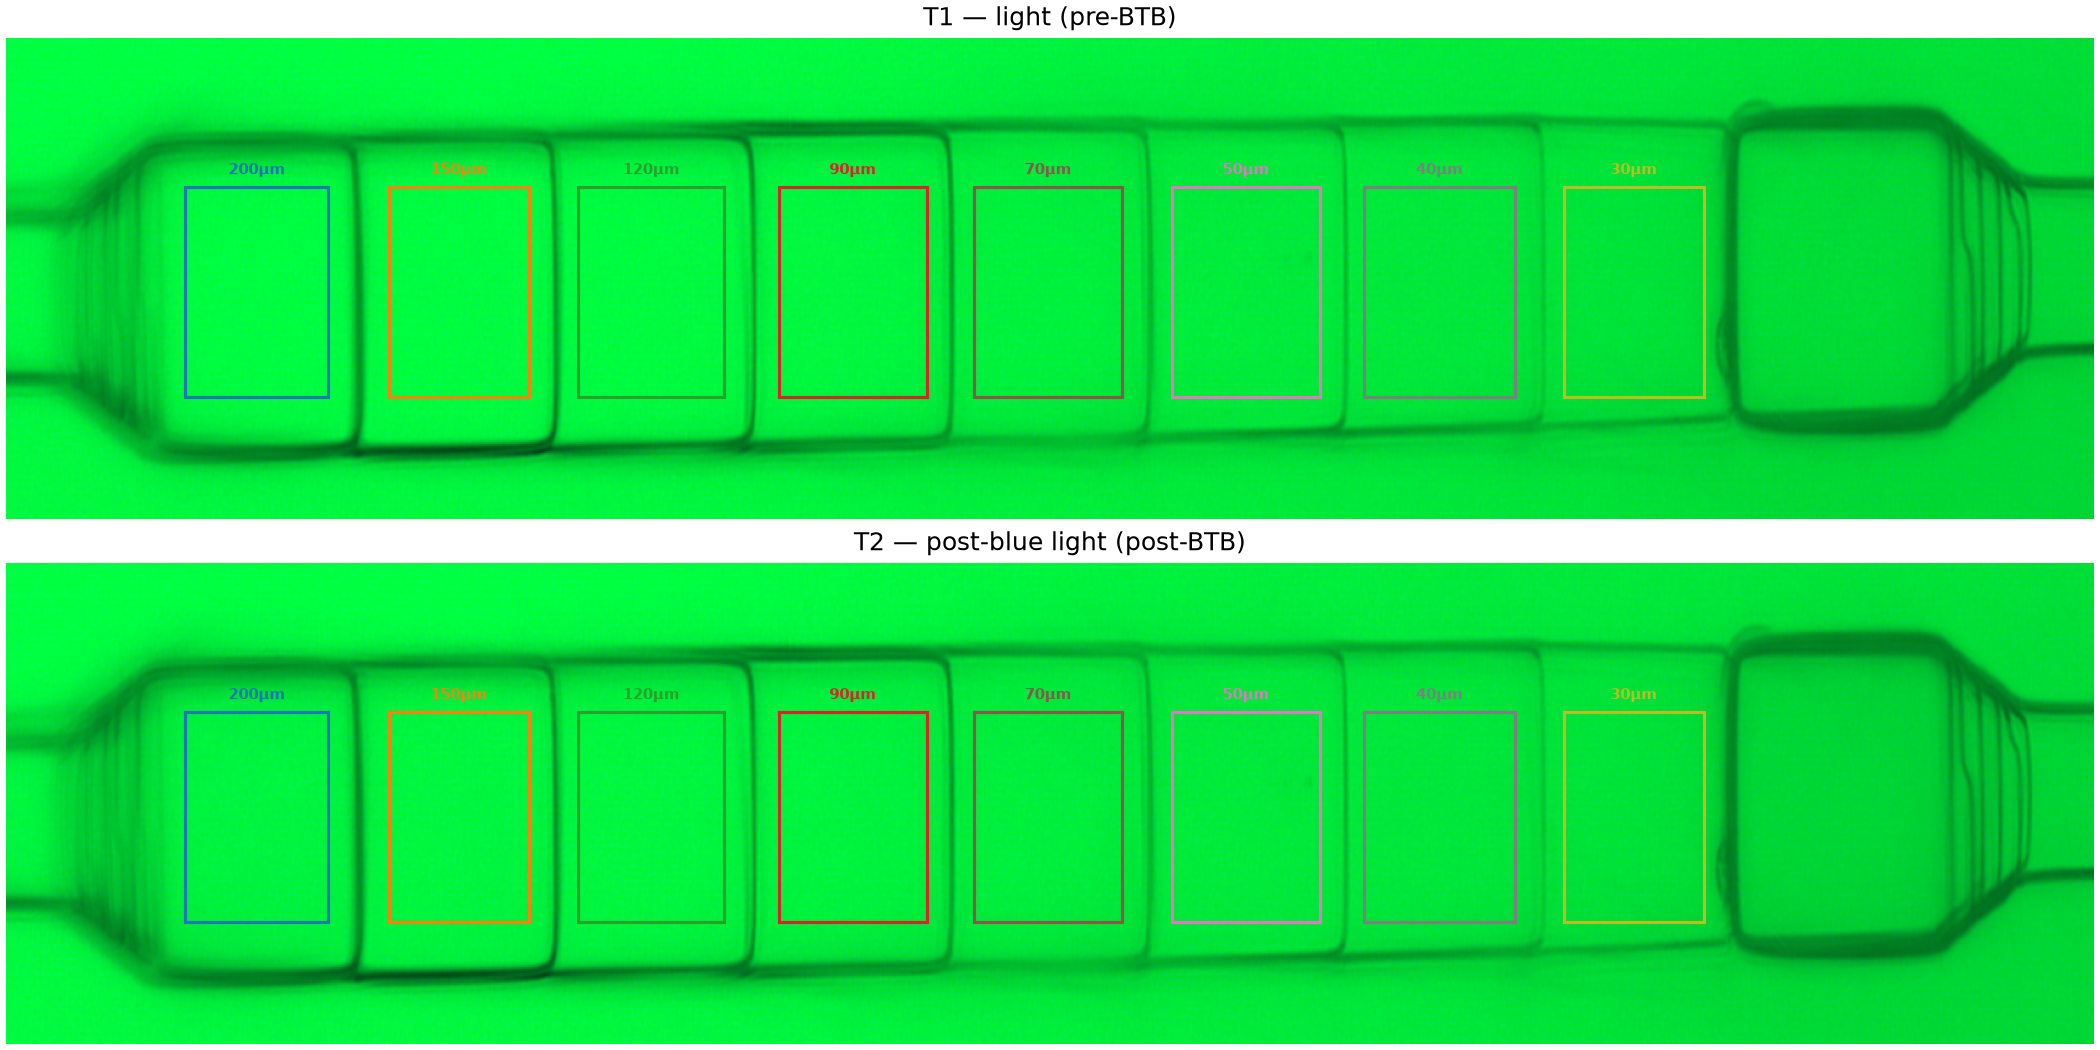
The stepped-height channel presents eight sections side-by-side across the image width. All sections share the same row band (83–201 px in cropped-image coordinates); each has its own column extent covering the flat interior of that depth step, avoiding the transition ramps.
Coordinates are taken directly from crop_and_roi.py and are fixed for all subsequent
analysis of this dataset.
Each light-field directory contains 30 frames captured in a single ~3–4 s burst; frames are averaged to suppress shot noise before display and analysis. The colour boxes mark the eight section ROIs used for all quantitative measurements.
Visually, deeper sections appear brighter even at 0 mM (no absorber): this is a genuine optical property of the channel geometry under transmitted illumination and is precisely why a depth-matched flat-field correction is required for every concentration measurement.
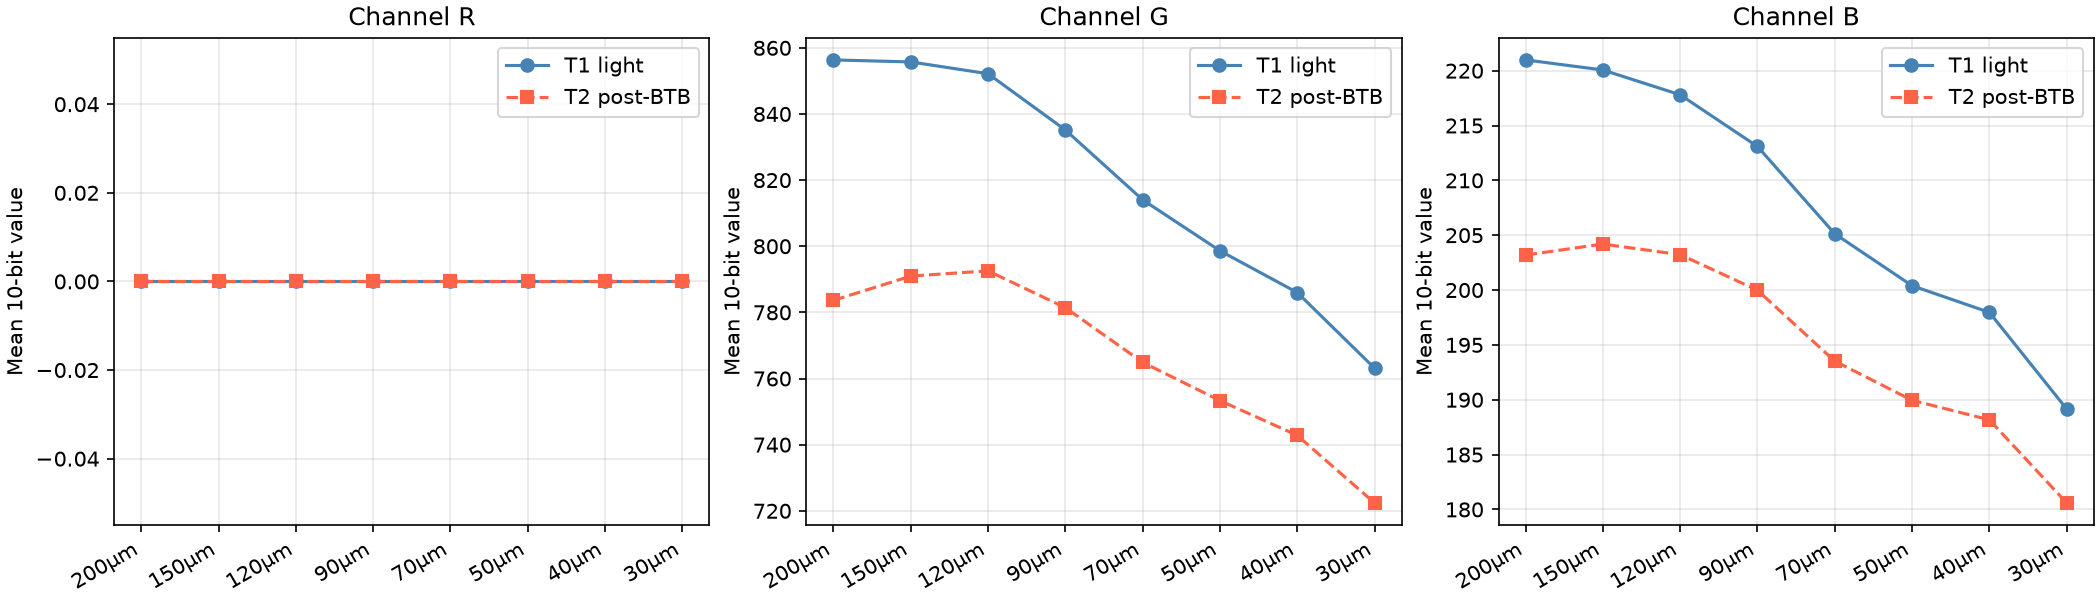
Mean 10-bit pixel values (raw 16-bit >> 6) in each ROI for the T1 and T2 averaged flat fields, split by colour channel. The R channel is identically zero in every ROI: the TRITC bandpass filter blocks all wavelengths that the camera registers in the red channel of this RGB sensor. Useful signal is carried entirely by the G channel (dominant) and B channel.
The gradient across sections — deeper sections brighter — is consistent across both timepoints and both active channels, confirming it reflects channel geometry rather than noise.
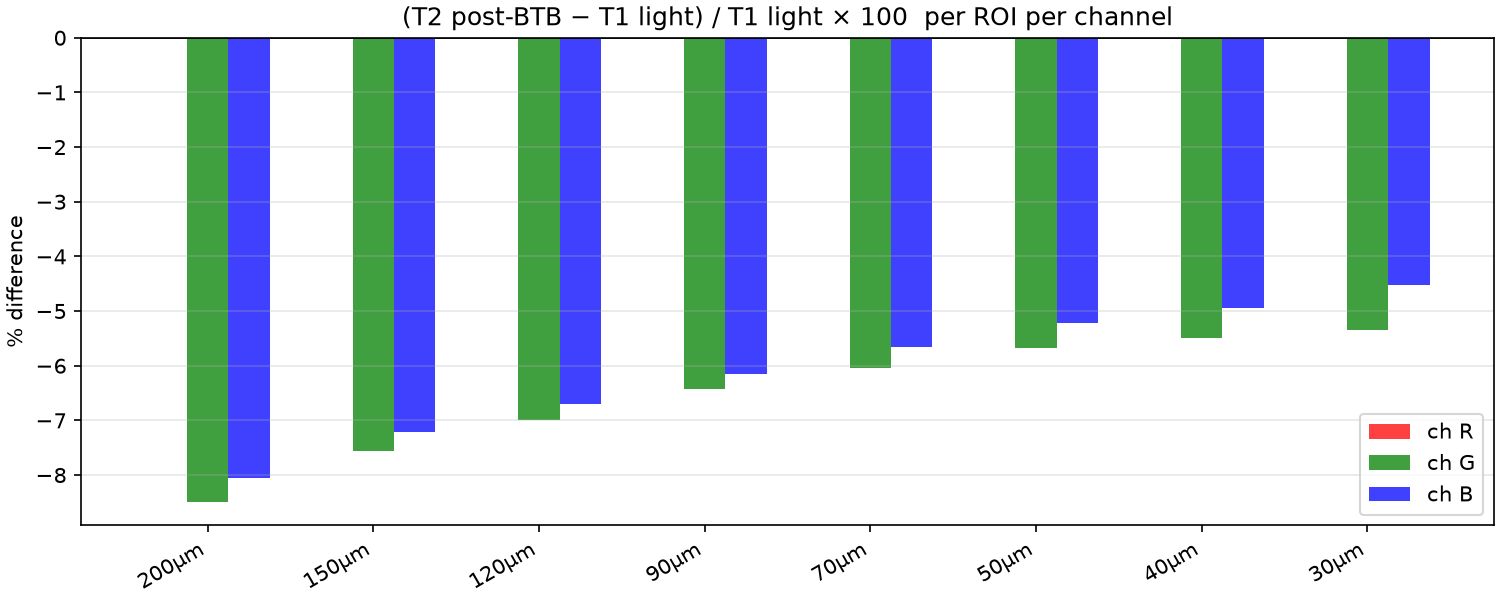
The bar chart shows (T2 − T1) / T1 × 100 for each section and channel. Because the R channel is zero, only the G and B bars carry information.
Key observation: the G-channel drop ranges from −8.5 % (deepest, 200 µm) to −5.3 % (shallowest, 30 µm) — a clear depth-dependent gradient with larger losses in deeper sections.
| Section | Channel | T1 light mean | T2 post-BTB mean | % diff |
|---|---|---|---|---|
| S1 (200µm) | R | 0.00 | 0.00 | +0.00% |
| S1 (200µm) | G | 856.35 | 783.63 | -8.49% |
| S1 (200µm) | B | 220.98 | 203.19 | -8.05% |
| S2 (150µm) | R | 0.00 | 0.00 | +0.00% |
| S2 (150µm) | G | 855.73 | 790.97 | -7.57% |
| S2 (150µm) | B | 220.06 | 204.19 | -7.21% |
| S3 (120µm) | R | 0.00 | 0.00 | +0.00% |
| S3 (120µm) | G | 852.17 | 792.56 | -7.00% |
| S3 (120µm) | B | 217.80 | 203.23 | -6.69% |
| S4 (90µm) | R | 0.00 | 0.00 | +0.00% |
| S4 (90µm) | G | 835.18 | 781.43 | -6.43% |
| S4 (90µm) | B | 213.09 | 199.98 | -6.15% |
| S5 (70µm) | R | 0.00 | 0.00 | +0.00% |
| S5 (70µm) | G | 814.06 | 764.90 | -6.04% |
| S5 (70µm) | B | 205.13 | 193.52 | -5.66% |
| S6 (50µm) | R | 0.00 | 0.00 | +0.00% |
| S6 (50µm) | G | 798.63 | 753.33 | -5.67% |
| S6 (50µm) | B | 200.40 | 189.95 | -5.21% |
| S7 (40µm) | R | 0.00 | 0.00 | +0.00% |
| S7 (40µm) | G | 786.01 | 742.82 | -5.49% |
| S7 (40µm) | B | 197.96 | 188.17 | -4.95% |
| S8 (30µm) | R | 0.00 | 0.00 | +0.00% |
| S8 (30µm) | G | 763.14 | 722.37 | -5.34% |
| S8 (30µm) | B | 189.16 | 180.59 | -4.53% |
Two mechanisms are consistent with the dense, anti-fouling PEGDA-250 Da network:
Residual dissolved BTB (dominant, depth-proportional). Flushing does not remove all dye. Residual BTB remaining in solution absorbs light following Beer–Lambert: A = εcl, where l is channel depth. Deeper sections absorb more. The effect is amplified because deeper sections have lower linear flow velocity (same volumetric flow, larger cross-section), so they flush less efficiently and retain a higher residual concentration c as well.
Surface adsorption (depth-independent floor). Even a monolayer of BTB on the PEGDA ceiling or glass floor would produce a constant absorbance independent of channel depth. The fact that even the shallowest section (30 µm) still loses ~5 % suggests a non-zero surface component alongside the bulk-dissolved component. However, PEG surfaces are well-known for low non-specific adsorption, so this contribution is expected to be small.
Practical consequence: T2 (post-blue light) captures the post-BTB channel state.
It is the appropriate flat-field for normalising the old-concentration images (T1 is
not appropriate because it was recorded before BTB exposure).
All 30 light in-between sets images were captured in a single ~2.8-second burst at 15:36:57,
between the last old-concentration sample (old/20 mM, 15:33) and the first new-concentration
sample (new/0 mM, 15:38). This matches the process.txt note: "A set of light correction
images was also taken between the sets of 13 samples."
We therefore have three averaged flat-field measurements forming a time sequence:
| Label | Directory | Time | Context |
|---|---|---|---|
| T1 | light |
15:02 | Before BTB dye |
| T2 | post-blue light |
15:08 | After BTB flush |
| T3 | light in-between sets |
15:36 | After 13 old-concentration sample runs |
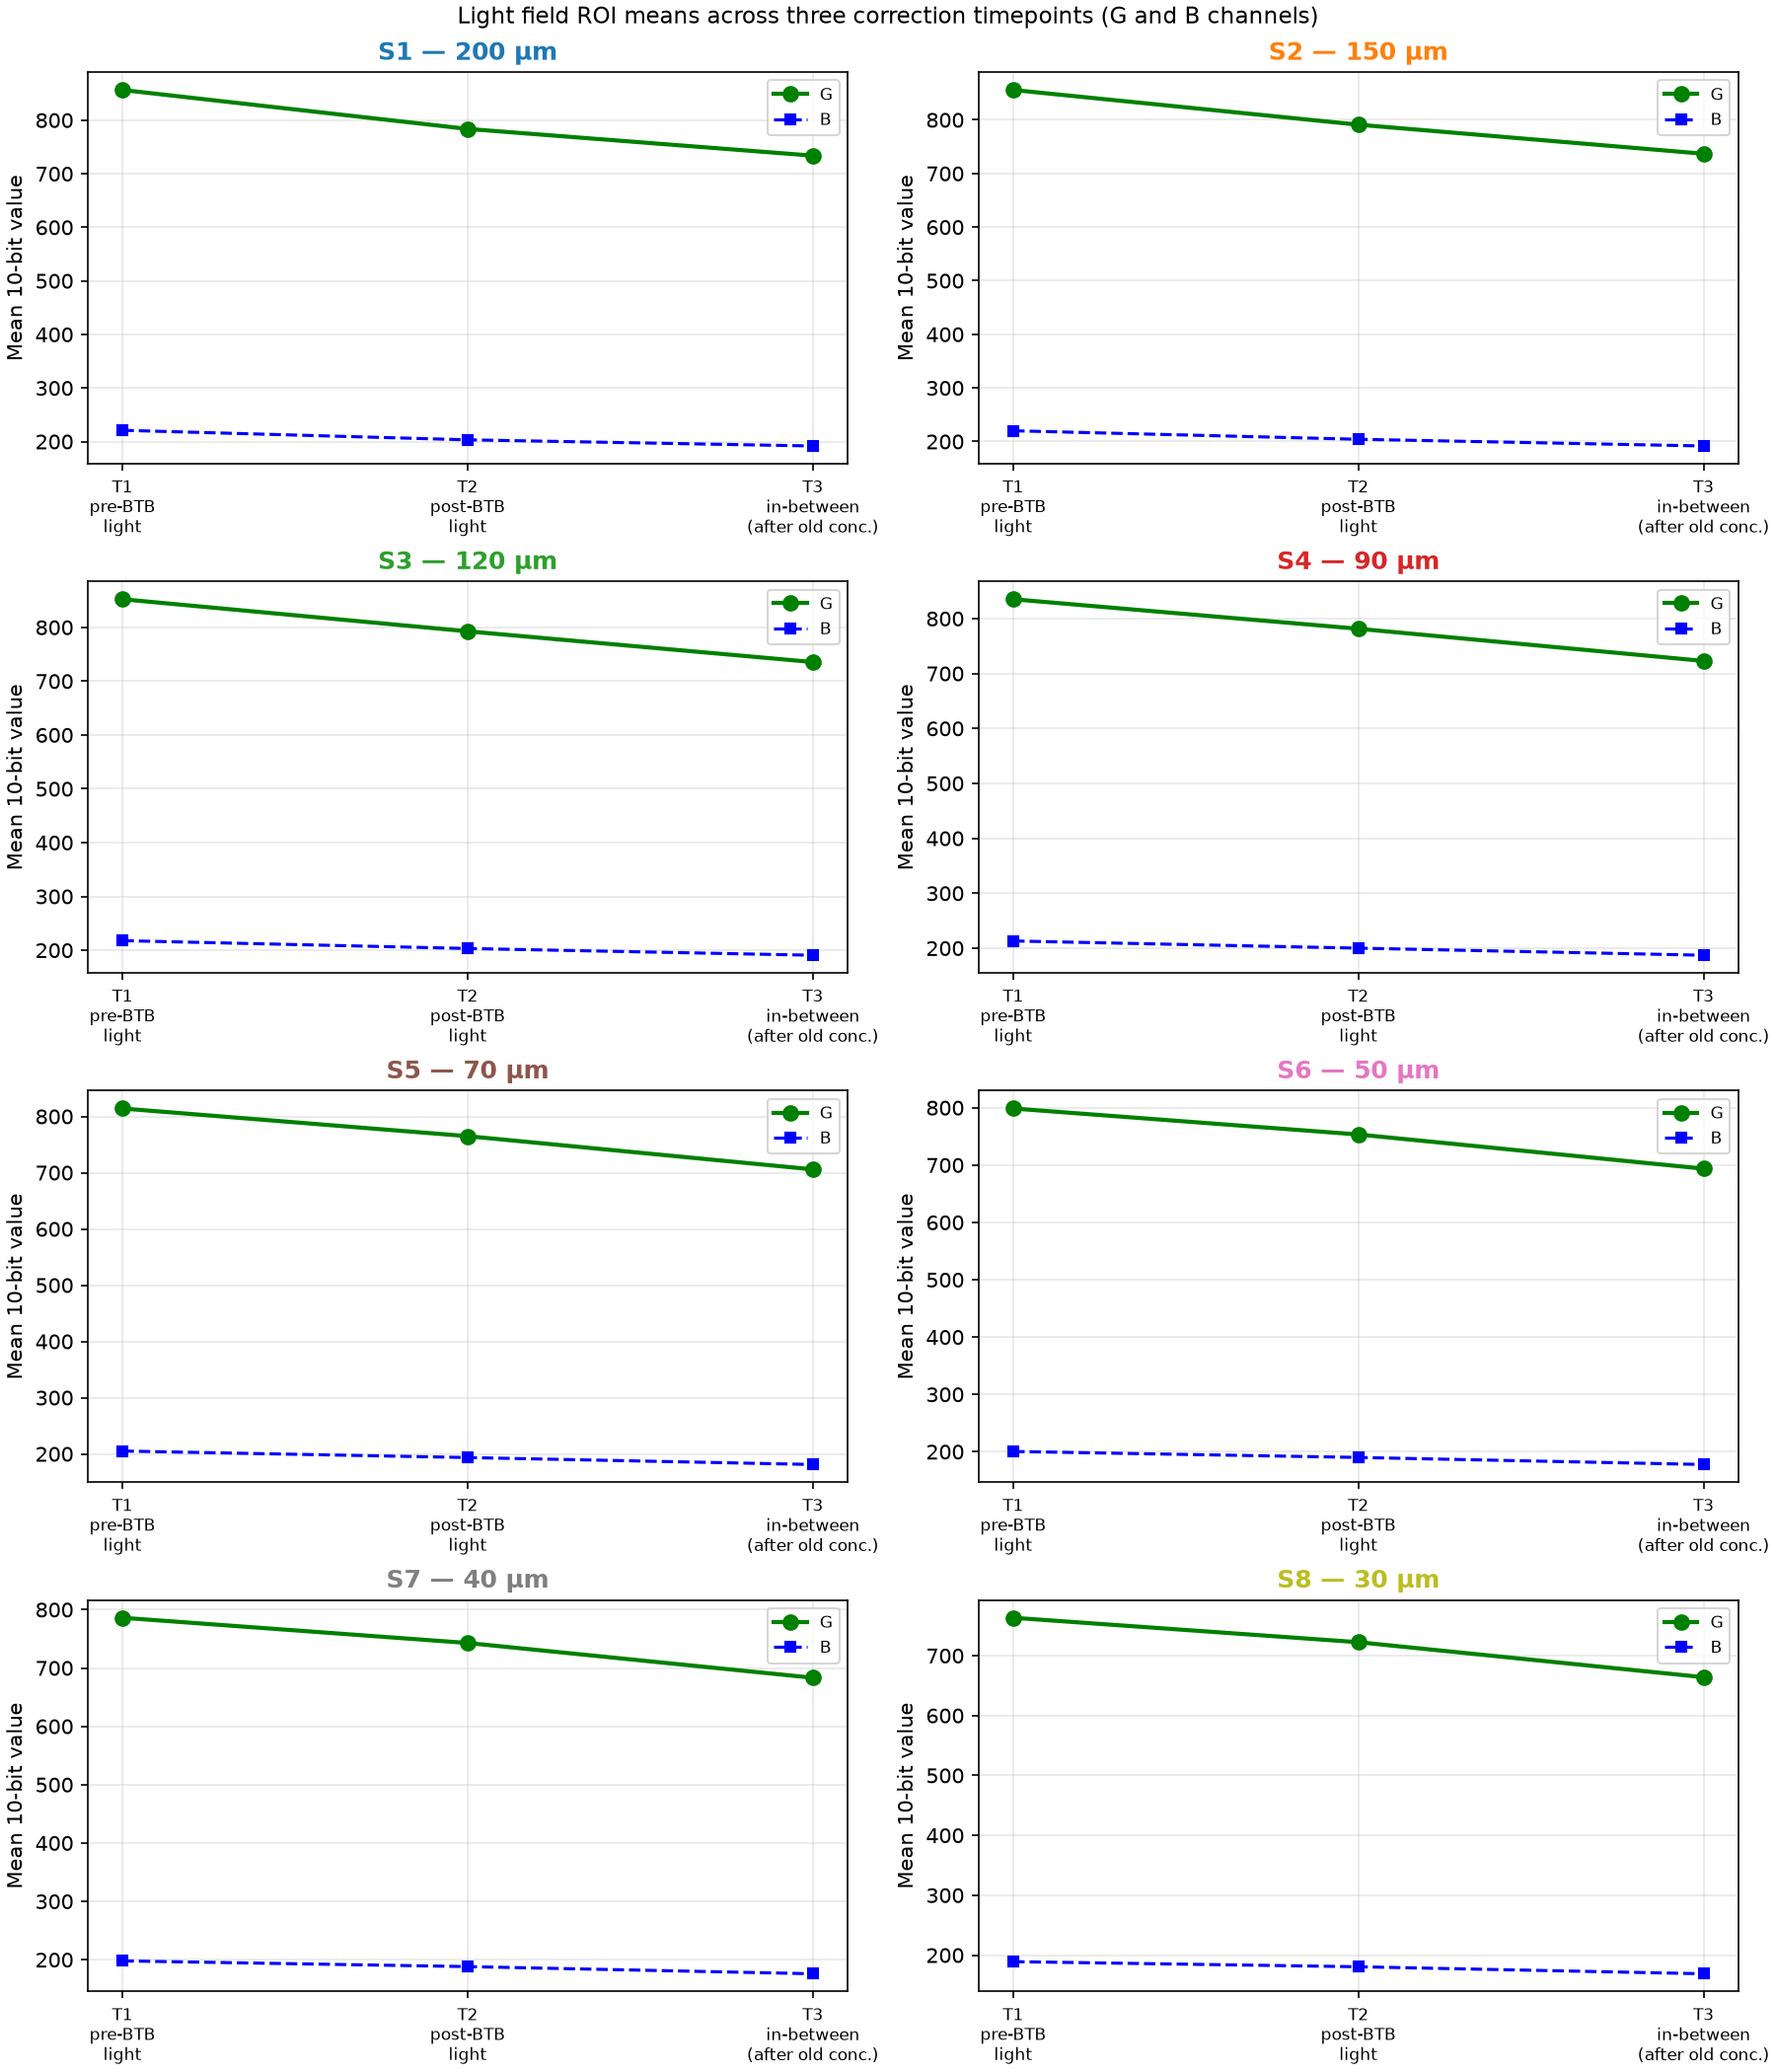
The analysis below asks: (a) how much did the flat-field change between T2 and T3, (b) does the depth-dependent pattern persist, reverse, or disappear, and (c) what mechanism explains the change?
| Step | Depth-dependence of G-channel drop |
|---|---|
| T1 → T2 (BTB flush) | Deeper sections drop more (−8.5 % at 200 µm → −5.3 % at 30 µm) |
| T2 → T3 (13 old-conc. runs) | Shallower sections drop more (−6.4 % at 200 µm → −8.1 % at 30 µm) |
| T1 → T3 (total) | Nearly uniform across all sections (−14.3 % → −13.0 %) |
The reversal between the two steps points to a different dominant mechanism for each:
T1→T2 — bulk dissolved BTB (∝ depth). Residual dye in solution; absorption scales with path length l. Deeper sections lose more.
T2→T3 — surface adsorption of phenol red (∝ 1/depth). The concentration samples contain phenol red as the colorimetric indicator — another sulfonphthalein dye. Phenol red adsorbs onto the channel surfaces (PEGDA ceiling and/or glass floor). The adsorbed layer has a fixed optical thickness t independent of channel depth d, so its contribution to absorbance scales as t/d: shallower sections lose a larger fraction of their light path to the adsorbed layer, producing the reversed gradient.
Why the total drop is nearly flat: The two depth-dependent effects point in opposite directions (∝ d and ∝ 1/d) and approximately cancel in the total, leaving a roughly uniform ~13–14 % reduction across all sections relative to T1.
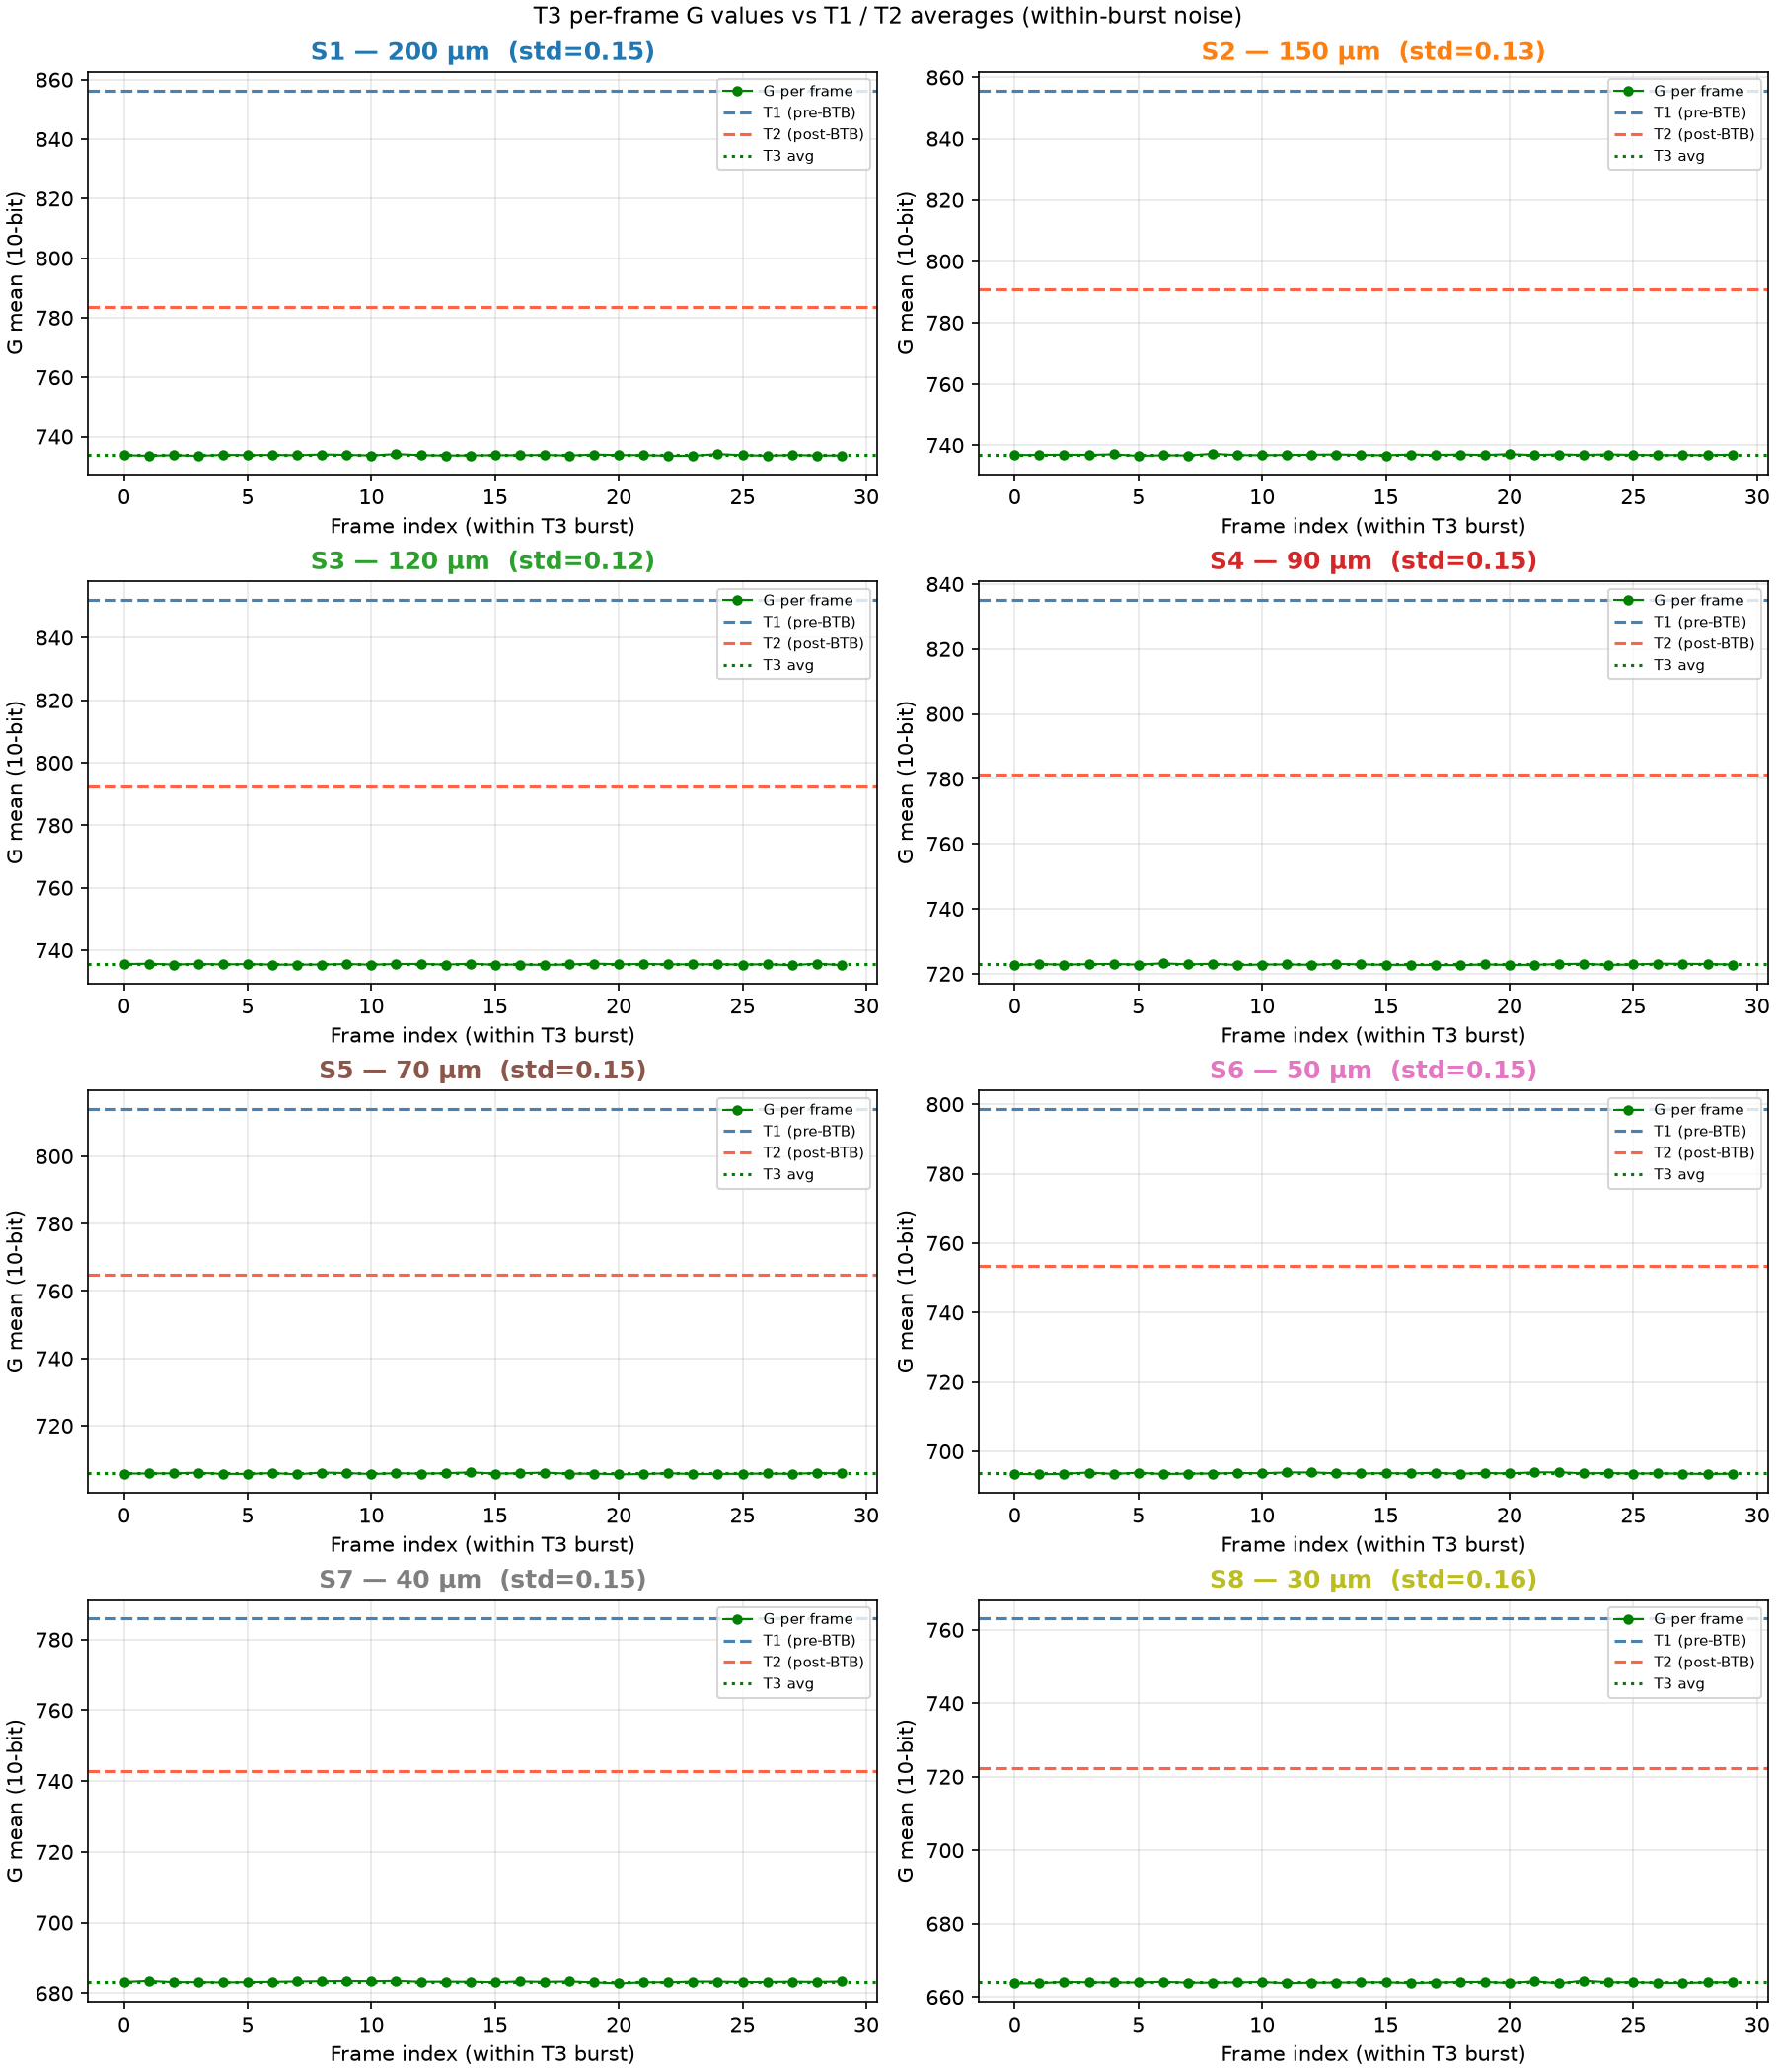
The 30 frames in the T3 burst were captured over ~2.8 s. The frame-to-frame standard deviation in G-channel ROI means is ≈ 0.15 counts (10-bit scale) across all sections — roughly 0.02 % of the mean signal. This confirms:
| Section | T1 light G | T2 post-BTB G | T3 in-between G | T2−T1 (%) | T3−T2 (%) | T3−T1 (%) |
|---|---|---|---|---|---|---|
| S1 (200µm) | 856.3 | 783.6 | 733.8 | -8.5% | -6.4% | -14.3% |
| S2 (150µm) | 855.7 | 791.0 | 736.8 | -7.6% | -6.8% | -13.9% |
| S3 (120µm) | 852.2 | 792.6 | 735.5 | -7.0% | -7.2% | -13.7% |
| S4 (90µm) | 835.2 | 781.4 | 722.9 | -6.4% | -7.5% | -13.4% |
| S5 (70µm) | 814.1 | 764.9 | 705.8 | -6.0% | -7.7% | -13.3% |
| S6 (50µm) | 798.6 | 753.3 | 693.7 | -5.7% | -7.9% | -13.1% |
| S7 (40µm) | 786.0 | 742.8 | 683.2 | -5.5% | -8.0% | -13.1% |
| S8 (30µm) | 763.1 | 722.4 | 663.9 | -5.3% | -8.1% | -13.0% |
The TRITC bandpass filter completely blocks the wavelengths captured in the camera's red channel. All subsequent analysis should use the G channel as the primary signal. The B channel tracks G but at roughly one-quarter the amplitude and can serve as a cross-check.
The channel transmission changes by ~5–14 % across the three correction timepoints, and the direction of depth dependence differs by step:
| Concentration group | Correct flat-field | Rationale |
|---|---|---|
| Old concentrations (0–20 mM, run 15:10–15:33) | T2 post-blue light |
Measured after BTB flush, before these samples |
| New concentrations (0–20 mM, run 15:38–16:00) | T3 light in-between sets |
Measured immediately before these samples |
Using T2 to normalise the new concentrations, or T1 to normalise either set, would introduce a systematic error of up to ~8 % in G-channel transmittance — large enough to significantly bias the concentration calibration.
Frame-to-frame variation within a burst is ≈ 0.15 counts (0.02 %), confirming that averaging 5 frames per concentration sample is sufficient and that the observed flat-field drift is entirely physical, not instrumental noise.