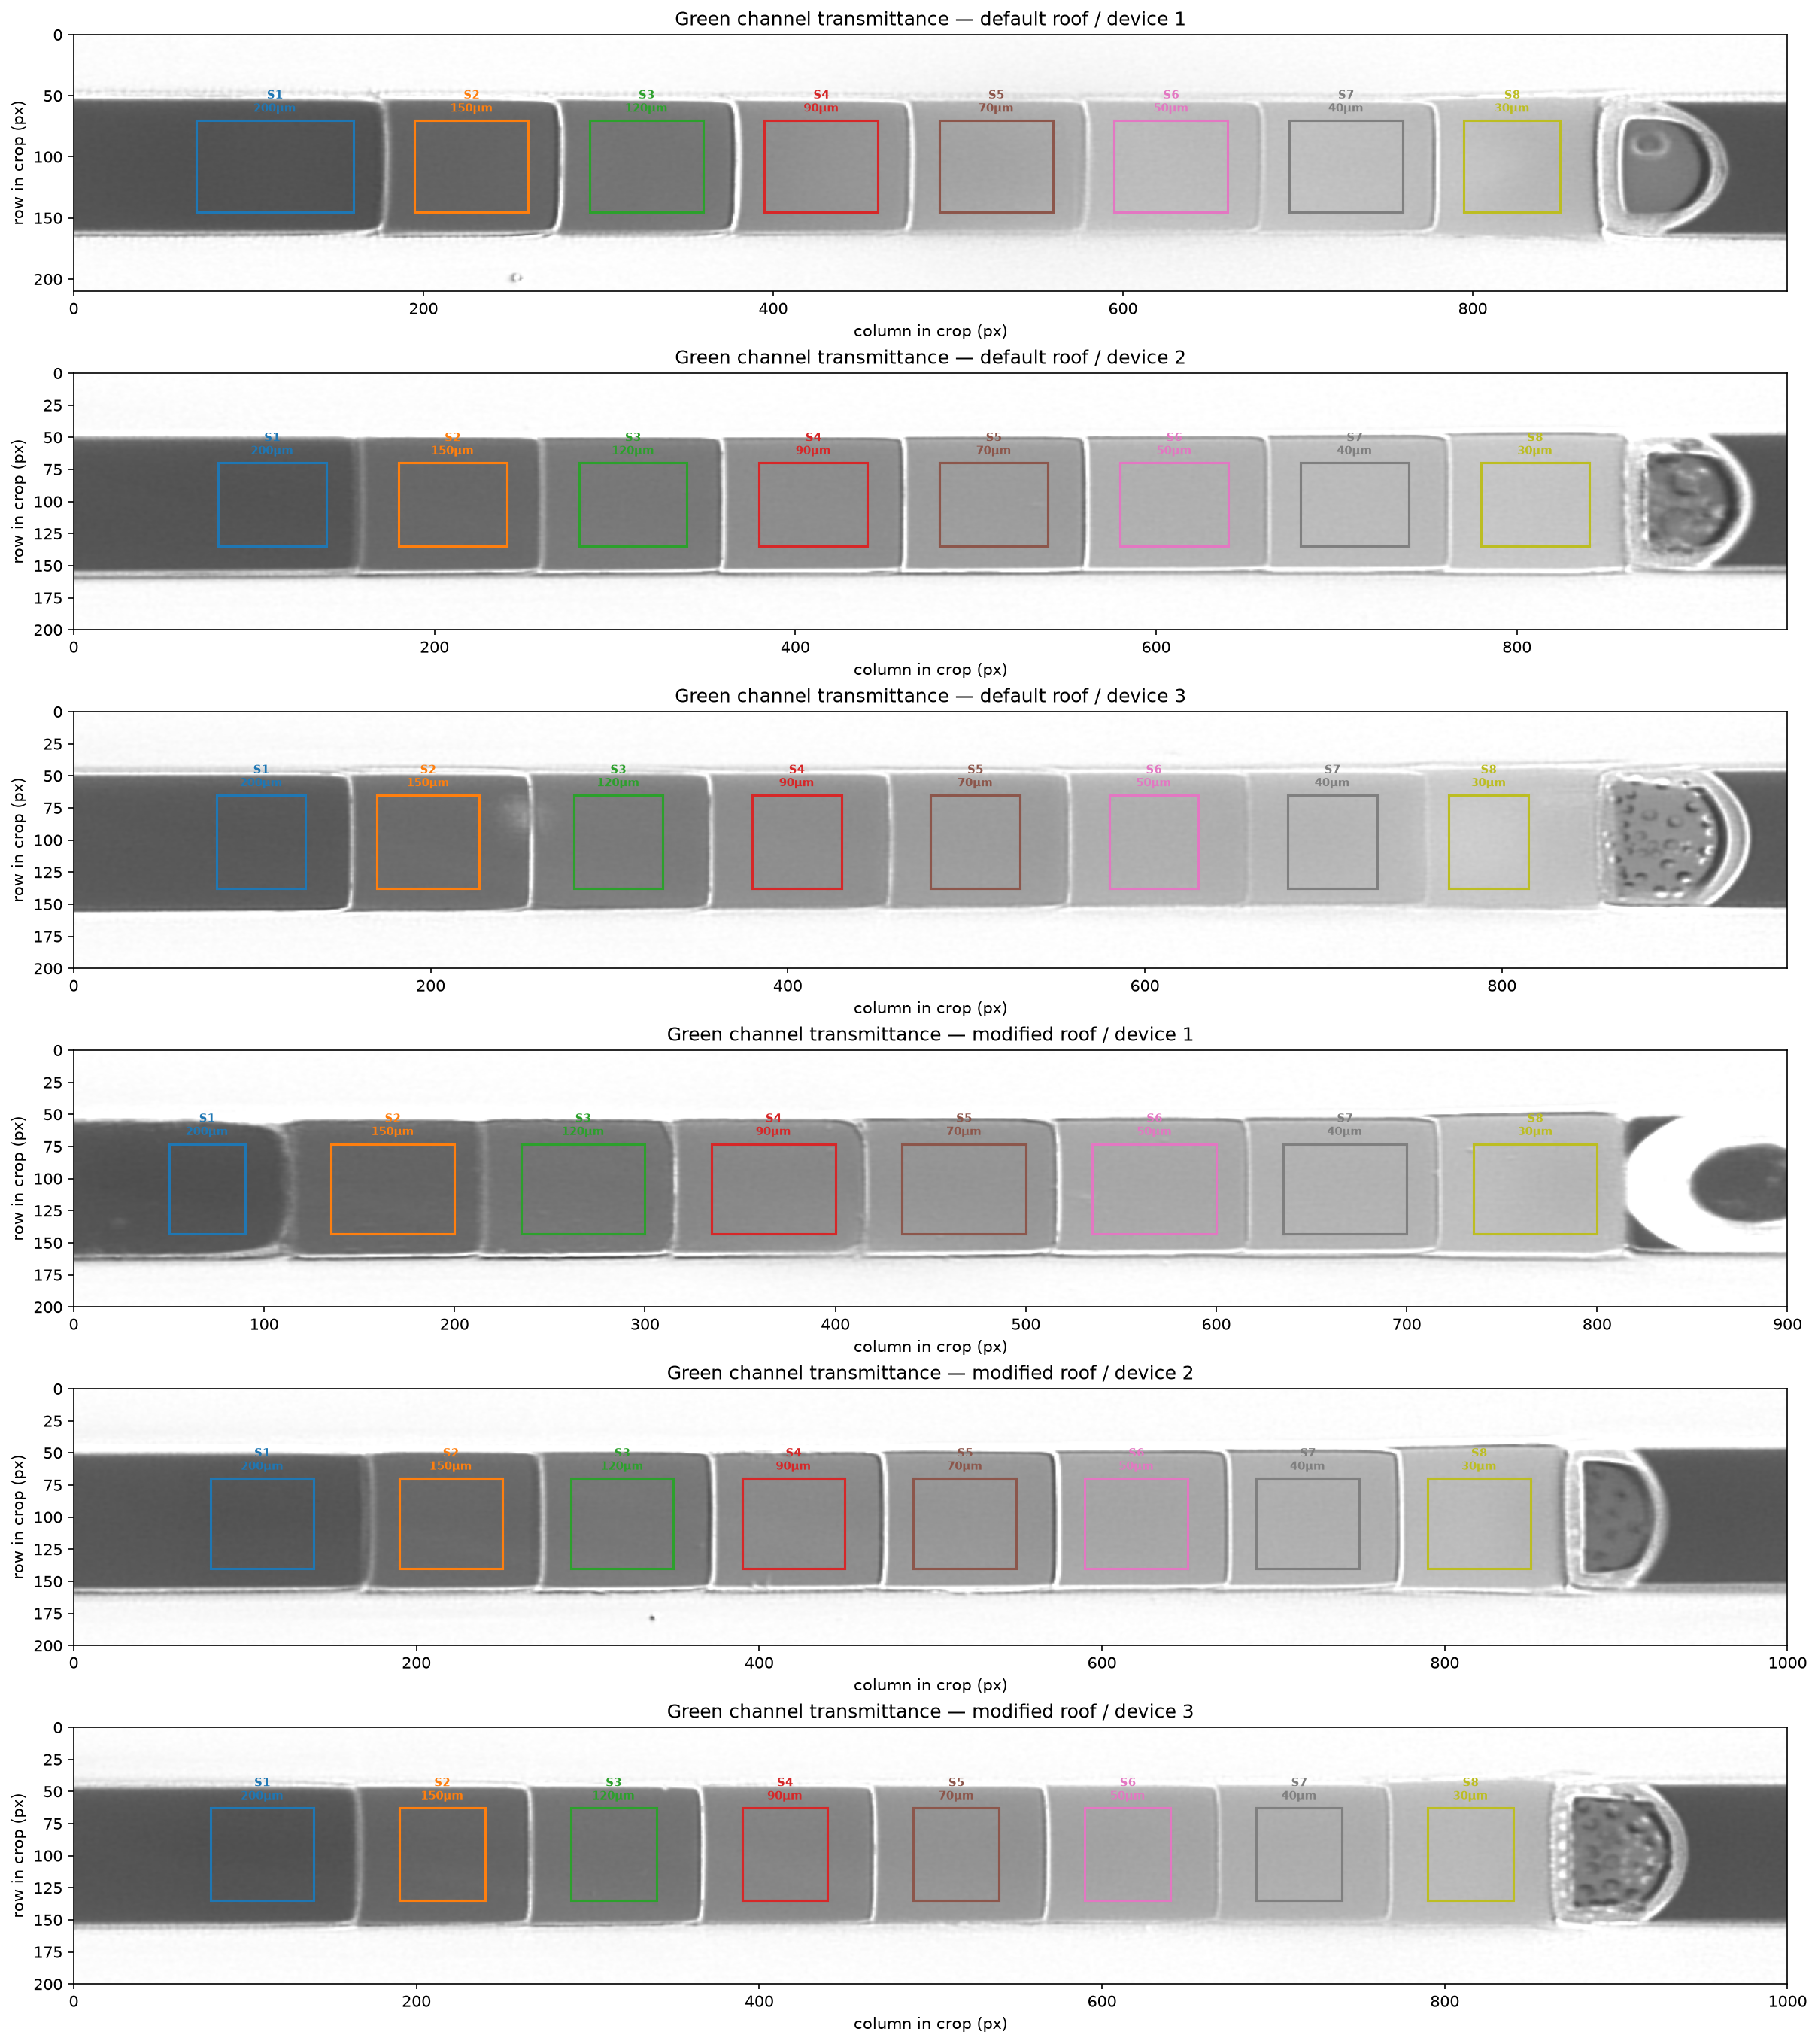
Six devices are compared across two roof geometries (three devices each): DR-D1, DR-D2, DR-D3 (default roof) and MR-D1, MR-D2, MR-D3 (modified roof). Each device has eight stepped-height channel sections (S1–S8, nominal depths 200–30 µm). The dye is Bromophenol Blue Indicator Solution (Biopharm, 0.4% w/v), used as-delivered. The camera images through a TRITC bandpass filter; the green Bayer channel is used for quantification.
calibrate_ec_eff.py).
Camera-measured value: $(\varepsilon c)_\text{eff} = 2.3822\ \text{AU/mm}$.
Channel heights are then inferred via Beer-Lambert:
$$l = \frac{A}{(\varepsilon c)_\text{eff}}, \qquad A = -\log_{10}(\bar T)$$
where $l$ is the actual channel height and $\bar T$ is the mean transmittance over the ROI.
Corrected transmittance $T = (I_\text{dye} - I_\text{dark}) / (I_\text{light} - I_\text{dark})$, green channel. Coloured boxes show the 8 ROIs used for per-section averaging. Darker regions correspond to higher dye absorbance (deeper channels).
Mean transmittance $\bar T$ is computed over each ROI, then converted to absorbance $A = -\log_{10}(\bar T)$. Averaging transmittance before taking the log matches the behaviour of a spatially-integrating detector.
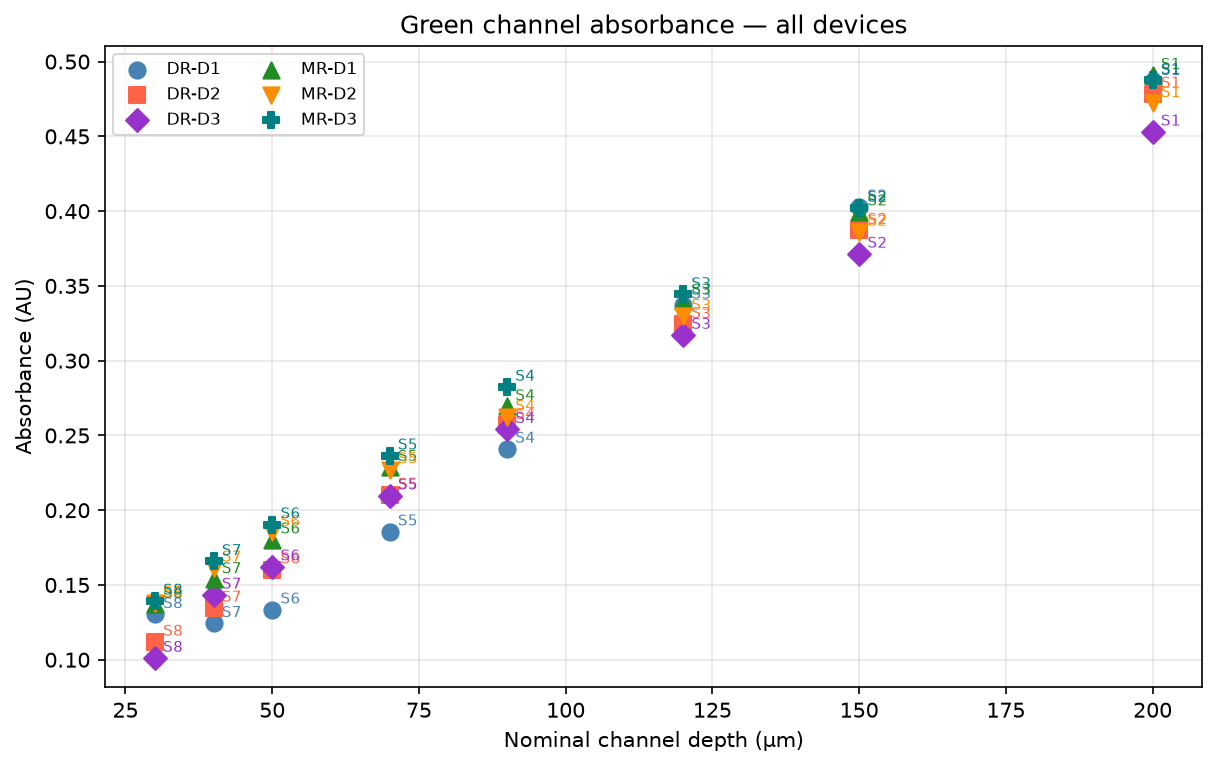
Heights inferred from $l = A\,/\,(\varepsilon c)_\text{eff}$ with $(\varepsilon c)_\text{eff} = 2.3822\ \text{AU/mm}$. The dashed line shows 1:1 agreement (actual = nominal).
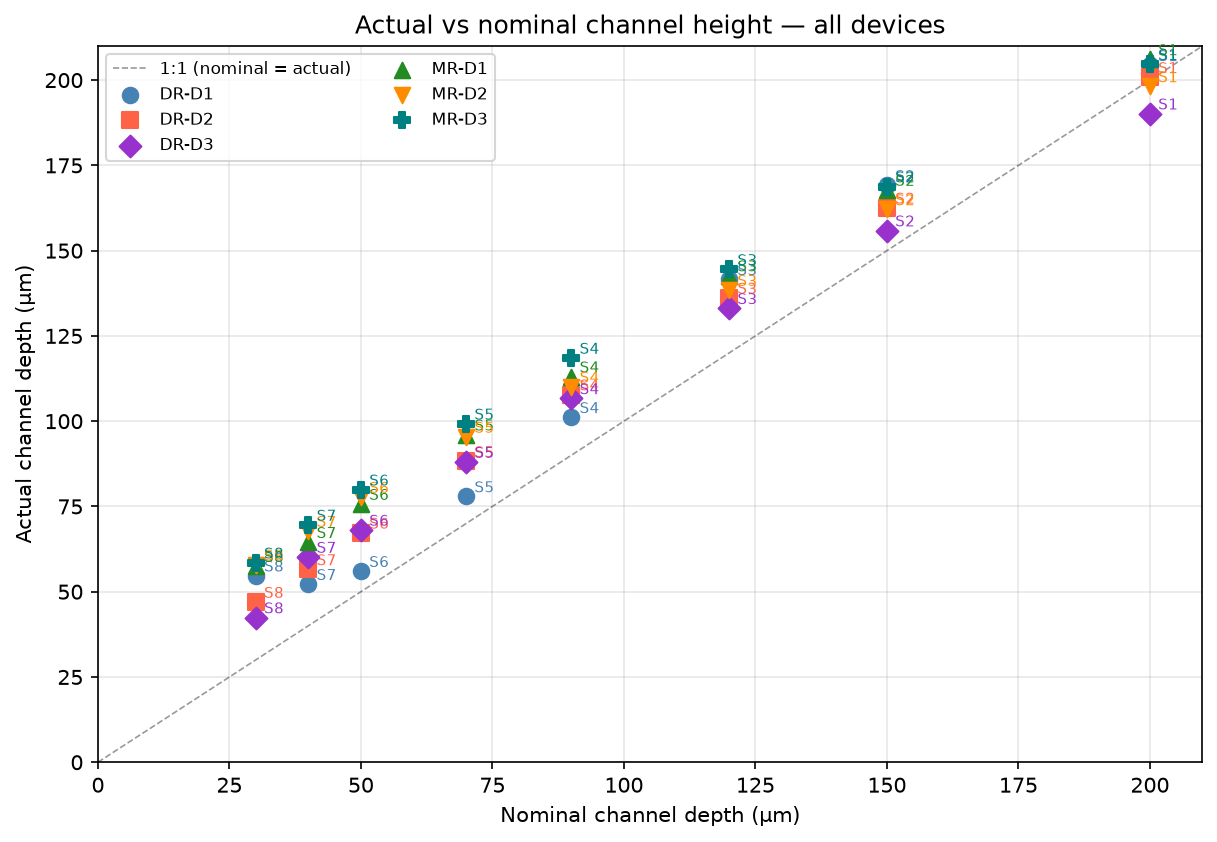
| Section | Nominal (µm) | DR-D1 | DR-D2 | DR-D3 | MR-D1 | MR-D2 | MR-D3 |
|---|---|---|---|---|---|---|---|
| S1 | 200 | 204.3 | 200.8 | 190.2 | 206.1 | 198.1 | 204.7 |
| S2 | 150 | 169.2 | 162.6 | 155.9 | 167.8 | 162.1 | 168.8 |
| S3 | 120 | 141.6 | 136.1 | 133.1 | 142.7 | 138.4 | 144.5 |
| S4 | 90 | 101.1 | 107.8 | 106.7 | 113.1 | 110.1 | 118.5 |
| S5 | 70 | 77.9 | 88.2 | 88.0 | 96.0 | 95.4 | 99.2 |
| S6 | 50 | 56.0 | 67.3 | 68.1 | 75.7 | 77.8 | 79.9 |
| S7 | 40 | 52.2 | 56.5 | 60.2 | 64.5 | 67.8 | 69.6 |
| S8 | 30 | 54.7 | 47.0 | 42.4 | 57.5 | 57.9 | 58.5 |
All values in µm. $(\varepsilon c)_\text{eff} = 2.3822\ \text{AU/mm}$ (camera-measured).
Mean ± 1 standard deviation across the three devices of each roof type (n = 3).
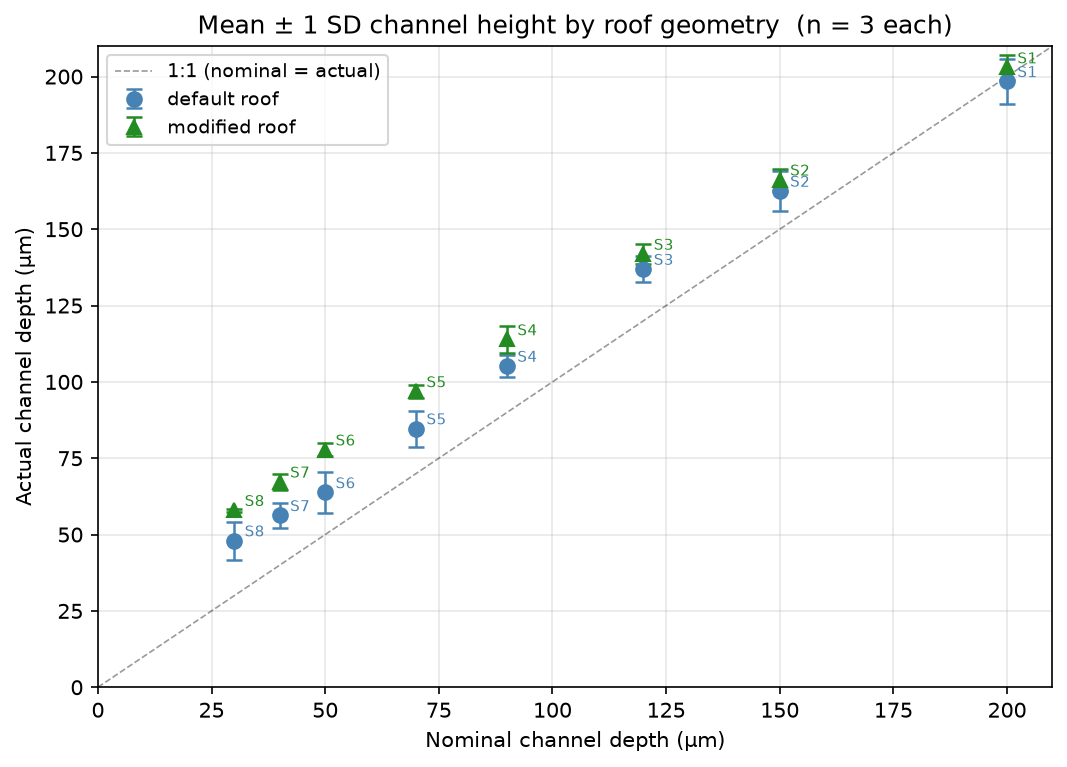
| Section | Nominal (µm) | Default roof (µm) | Modified roof (µm) |
|---|---|---|---|
| S1 | 200 | 198.4 ± 7.4 | 203.0 ± 4.2 |
| S2 | 150 | 162.5 ± 6.6 | 166.2 ± 3.6 |
| S3 | 120 | 136.9 ± 4.3 | 141.9 ± 3.1 |
| S4 | 90 | 105.2 ± 3.6 | 113.9 ± 4.3 |
| S5 | 70 | 84.7 ± 5.9 | 96.9 ± 2.1 |
| S6 | 50 | 63.8 ± 6.8 | 77.8 ± 2.1 |
| S7 | 40 | 56.3 ± 4.0 | 67.3 ± 2.6 |
| S8 | 30 | 48.0 ± 6.2 | 58.0 ± 0.5 |
Values shown as mean ± 1 SD (µm).
Sections S2–S6 run 8–60% above nominal. Inferred depths consistently exceed the CAD design, with overshoot increasing toward shallower sections.