Spectral characterization of the dyes and filter sets used in the microfluidic urea colorimetric assay, followed by quantification of polychromatic Beer-Lambert errors relevant to channel height measurements on the Olympus IX71 microscope.
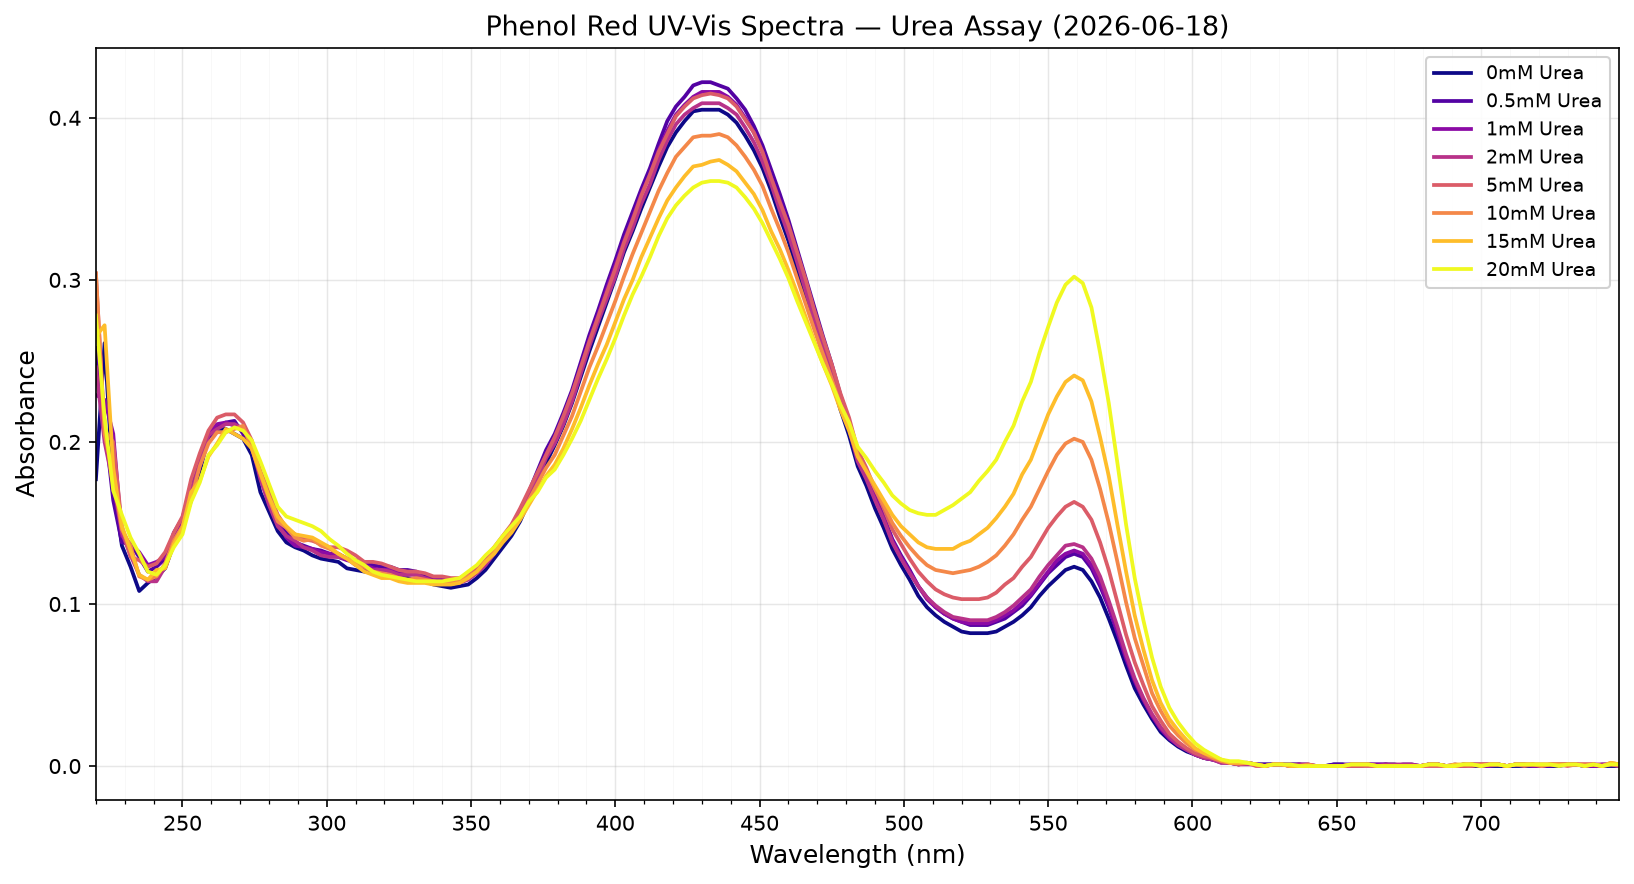
Phenol Red is the colorimetric indicator in the urea assay. Urease converts urea to ammonia, raising the pH and shifting Phenol Red from its yellow acidic form to its red/pink alkaline form. Absorbance spectra were measured on a Nanodrop (0.1 mm path) across urea concentrations of 0–20 mM. The absorption peak near 430 nm grows and shifts as urea concentration (and thus pH) increases.
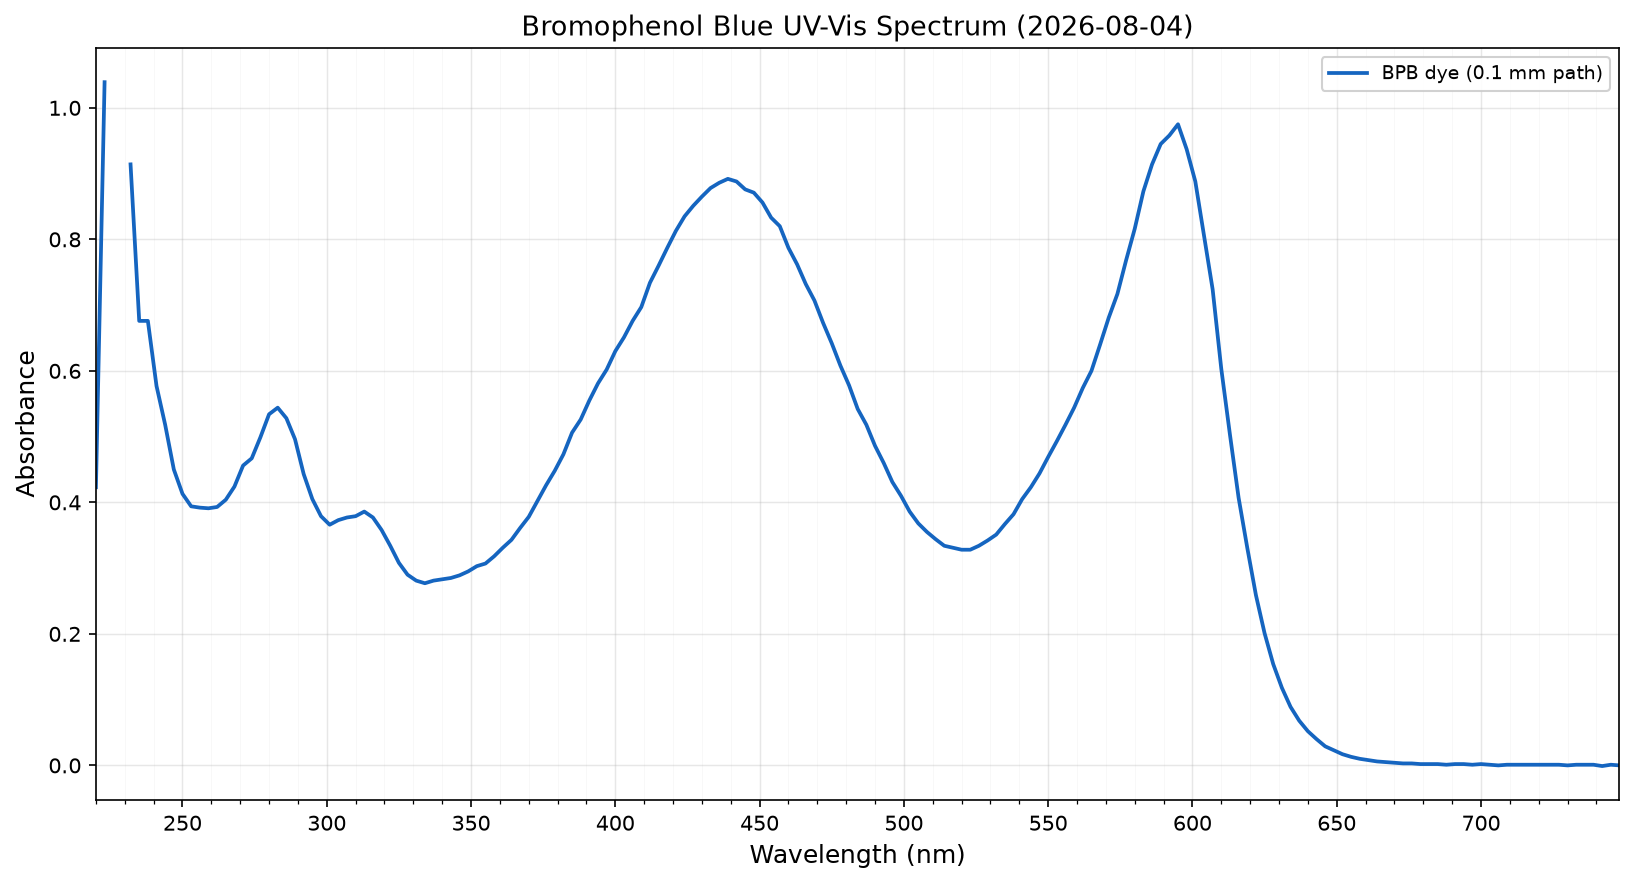
BPB spectrum measured at 0.1 mm path length on a Nanodrop. BPB has a broad visible absorption band peaking near 595 nm (the deprotonated blue form) that varies significantly in absorbance across the 500–650 nm range, making it sensitive to polychromatic measurement errors.
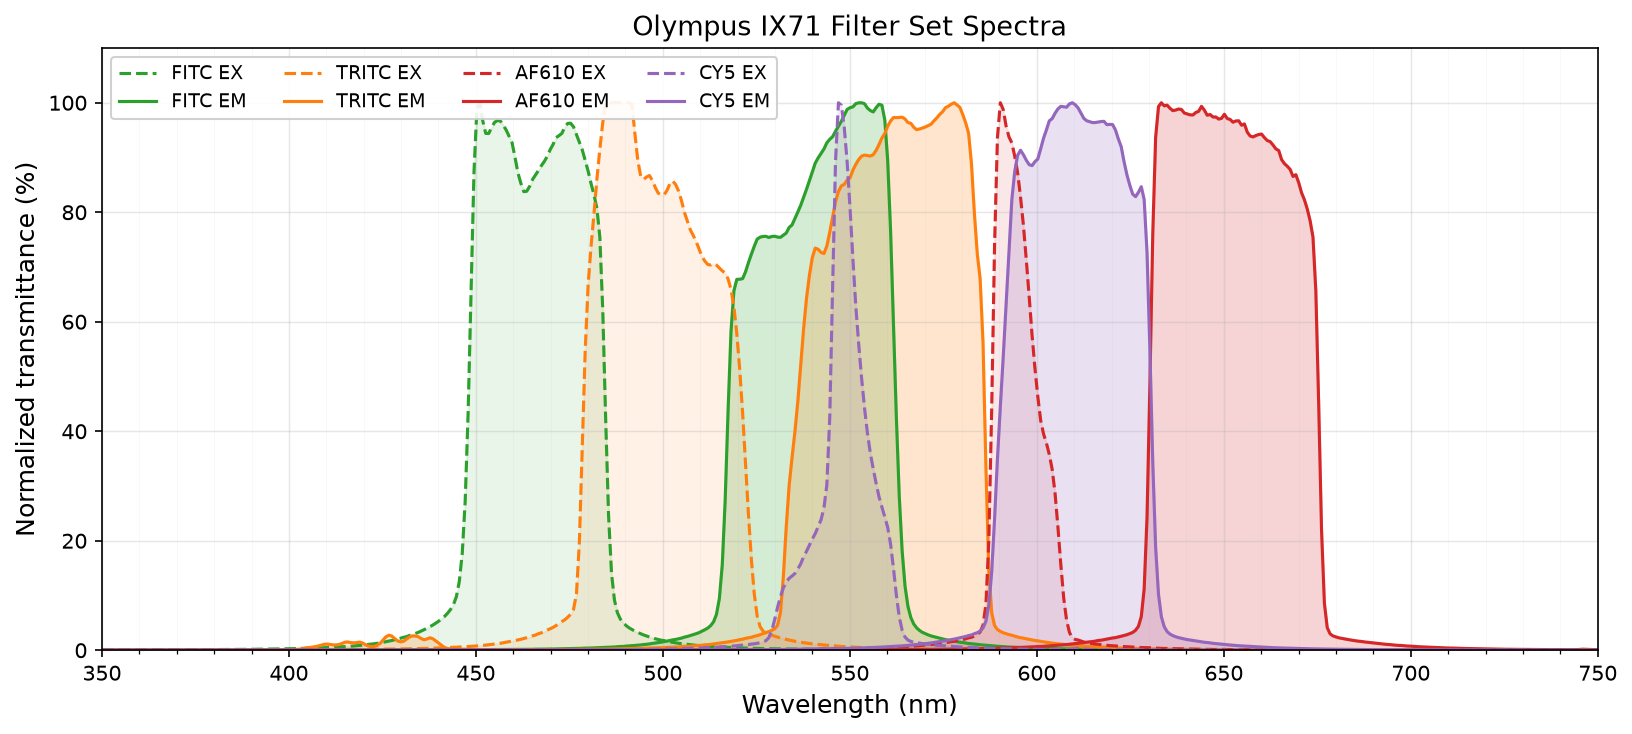
Measured transmittance spectra for the four fluorescence filter cubes of the Olympus IX71 inverted microscope (FITC, TRITC, AF610, CY5). Each cube contributes an excitation (EX, dashed) and emission (EM, solid) filter. Spectra are normalized to their individual peak values.
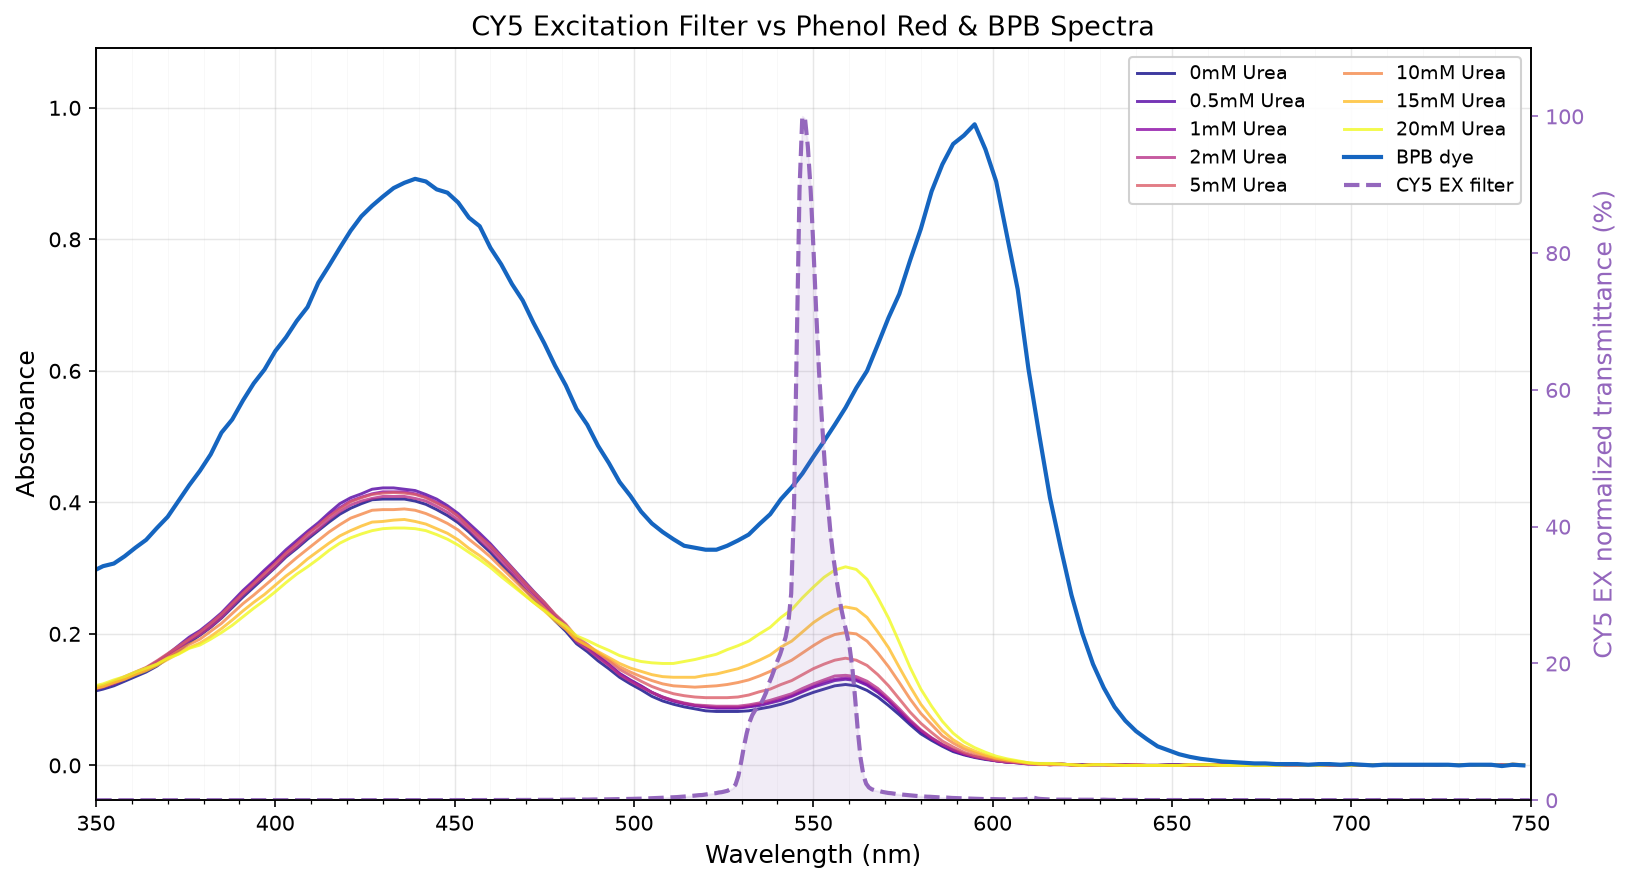
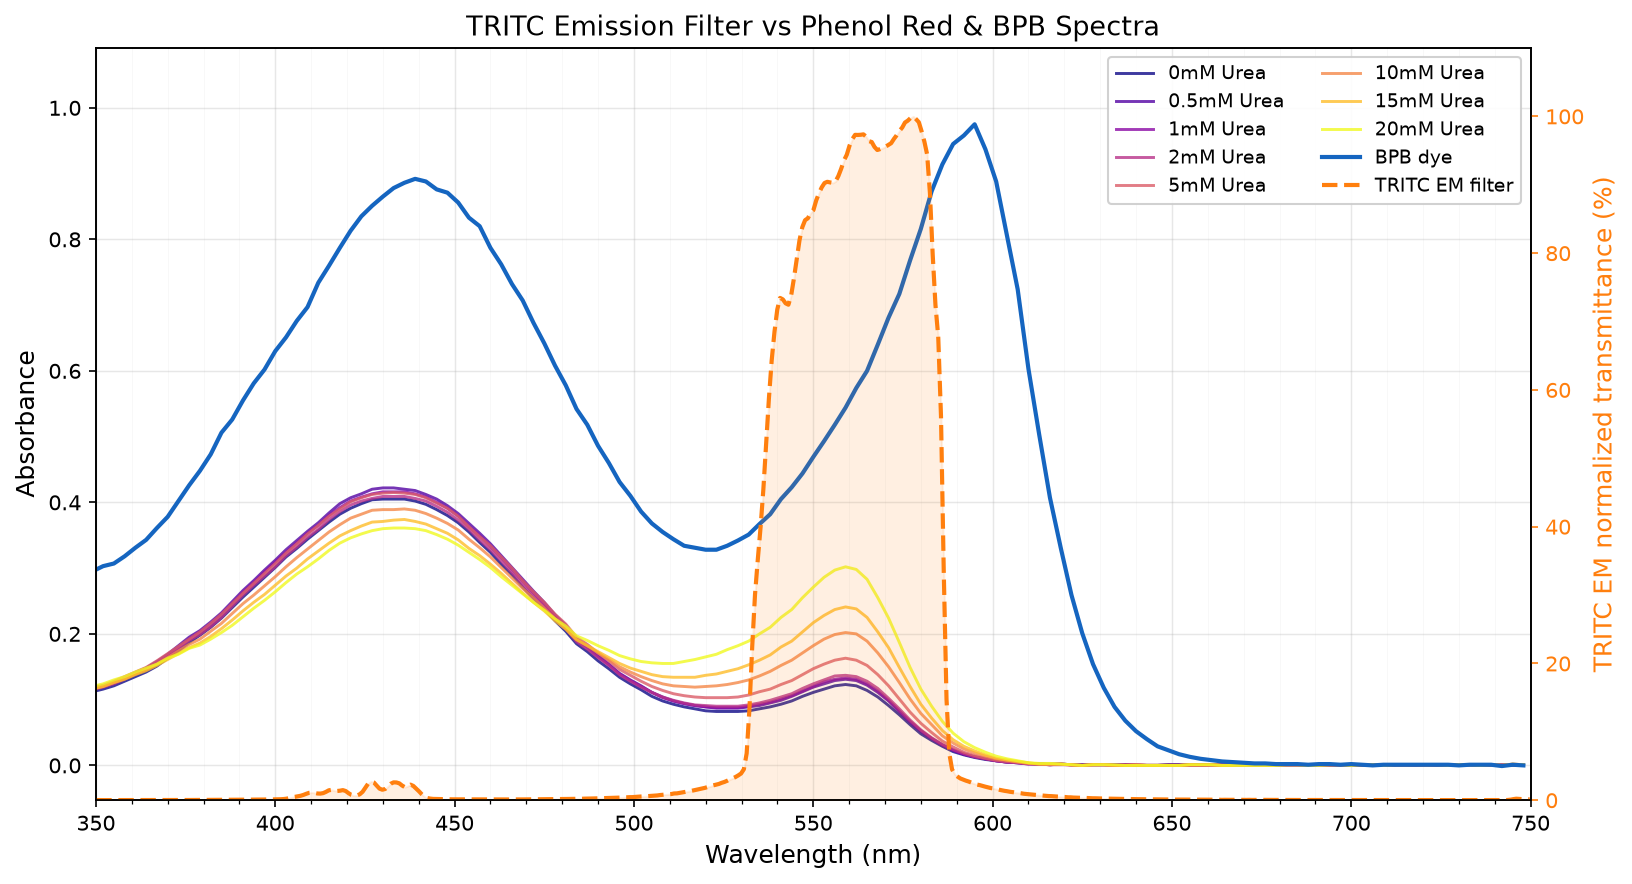
Overlay of the dye absorbance spectra (Phenol Red at each urea concentration and BPB) against individual filter passbands. The right axis shows normalized filter transmittance; the left axis shows raw absorbance. Spectral overlap between a filter and a dye determines how much of the incident light is attenuated by the dye before reaching the detector.
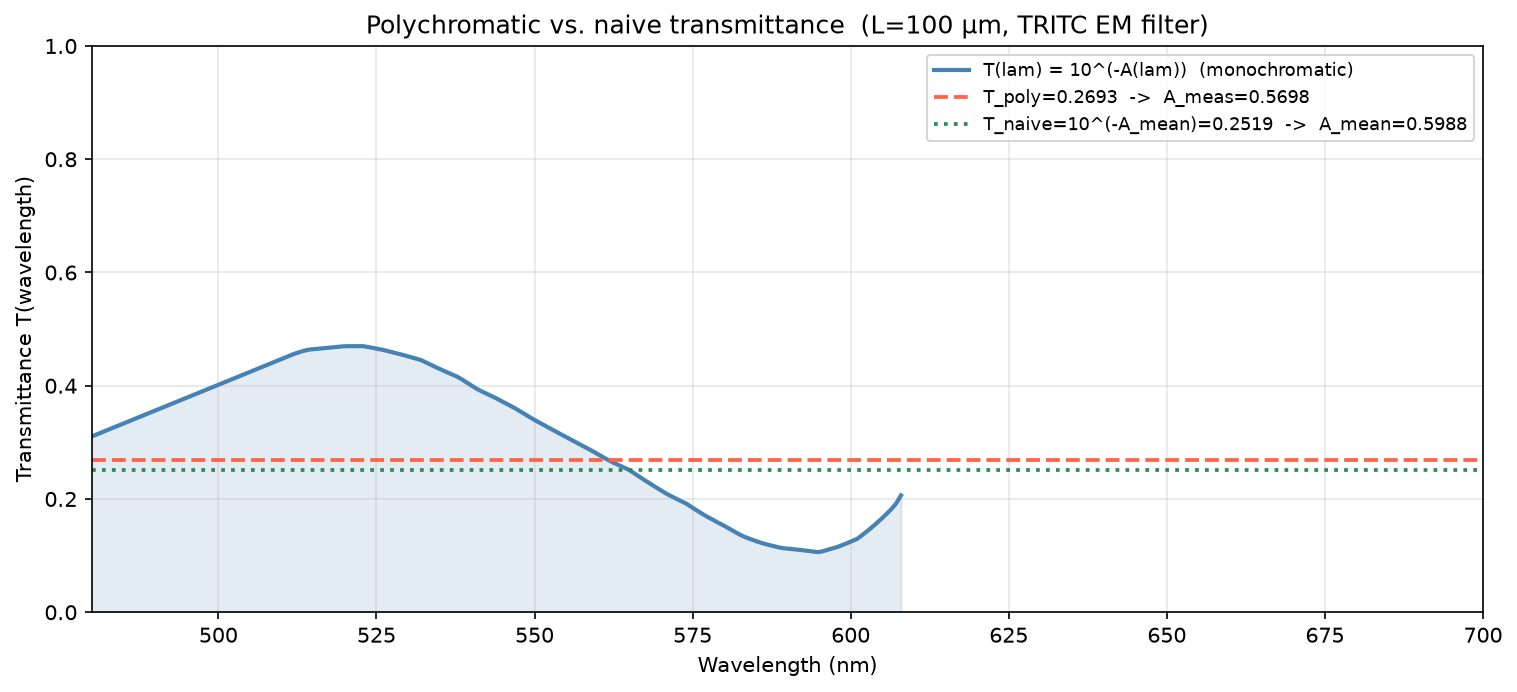
A camera that images through a bandpass filter integrates transmitted intensity over all wavelengths in the passband rather than measuring at a single wavelength. When the dye's absorbance varies across the passband, the detected transmittance is the filter-weighted average of monochromatic transmittances:
Because $10^{-A}$ is convex in $A$ (Jensen's inequality), $T_\text{poly} > 10^{-\langle A\rangle}$, so the measured absorbance $A_\text{meas} = -\log_{10}(T_\text{poly})$ systematically underestimates the true absorbance. This causes systematic errors in channel height estimates that grow with path length and dye concentration.
The analysis below uses the actual measured BPB absorbance spectrum and TRITC EM emission filter transmittance (not idealized models).
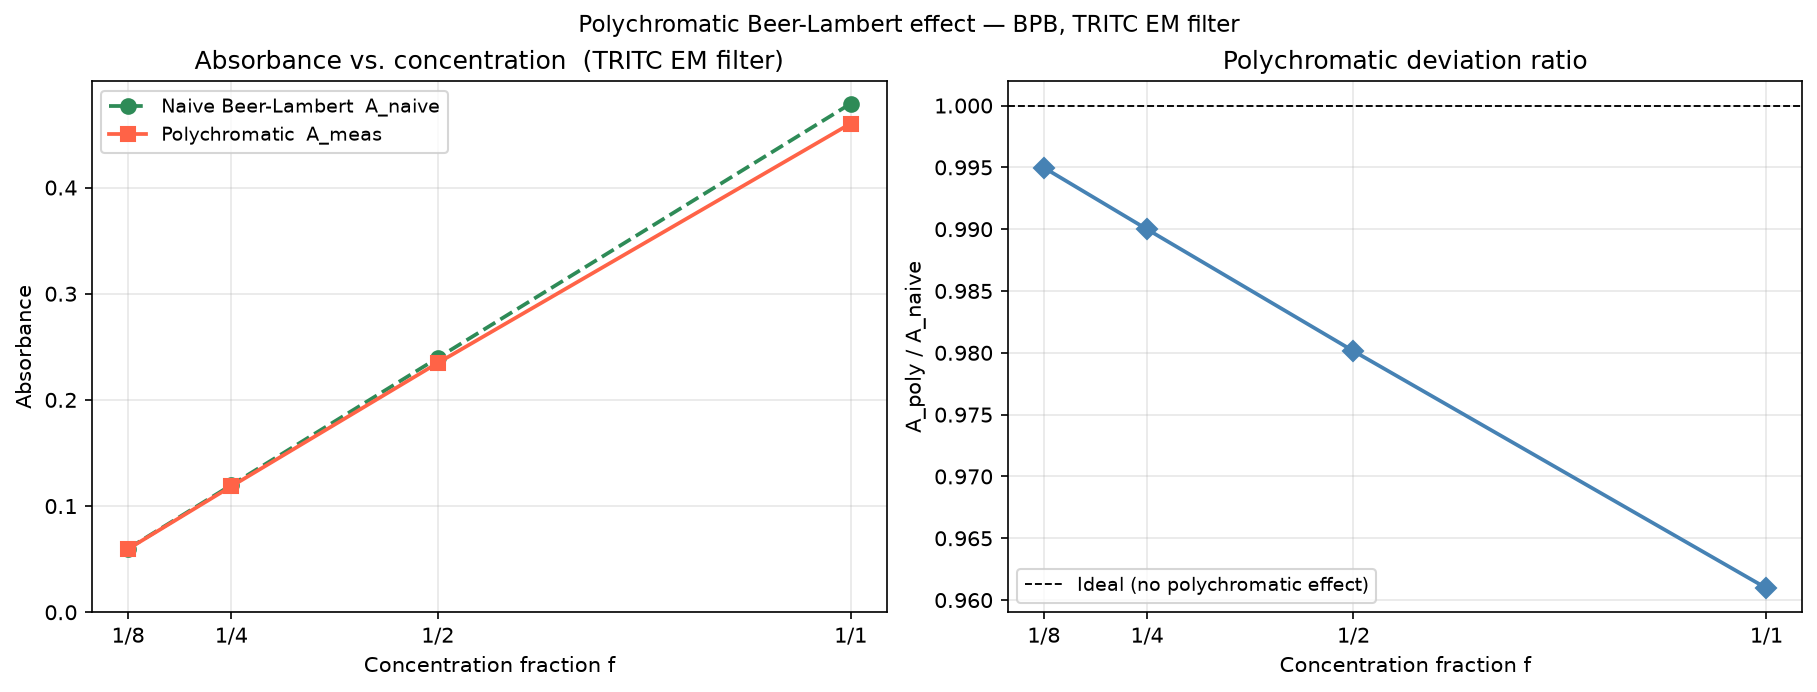
The TRITC emission filter passband spans the rising edge of the BPB absorbance peak, so absorbance varies substantially across the bandpass — the polychromatic effect is expected to be larger here than for the CY5 EX filter.
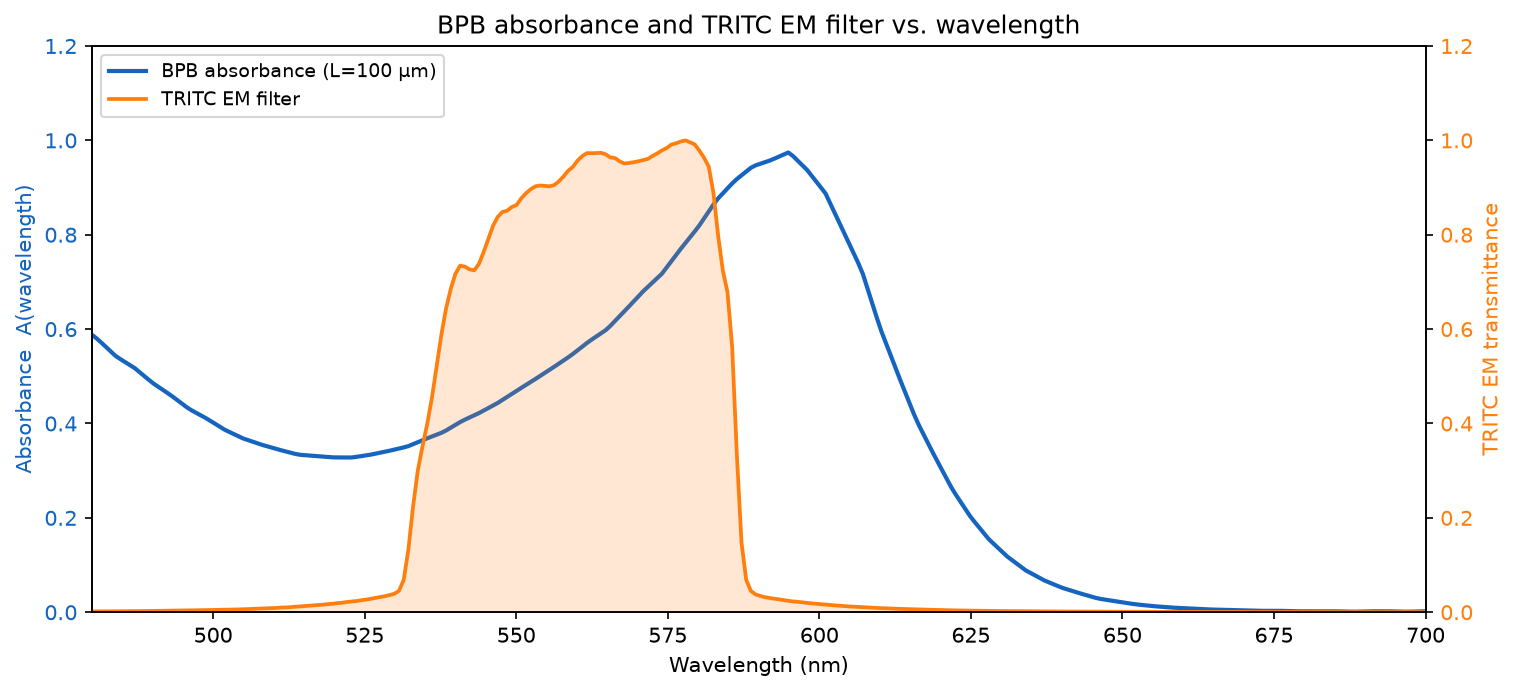
Computing $T_\text{poly}$ and comparing it to the naive $T_\text{naive} = 10^{-\langle A \rangle}$ quantifies the magnitude of the polychromatic error at the Nanodrop measurement path length.
Scaling the BPB absorbance by concentration fraction $f \in \{1/8, 1/4, 1/2, 1\}$ at the 80 µm capillary path length shows how $A_\text{meas}$ diverges from the linear Beer-Lambert prediction as the total absorbance product $\varepsilon c \ell$ increases.
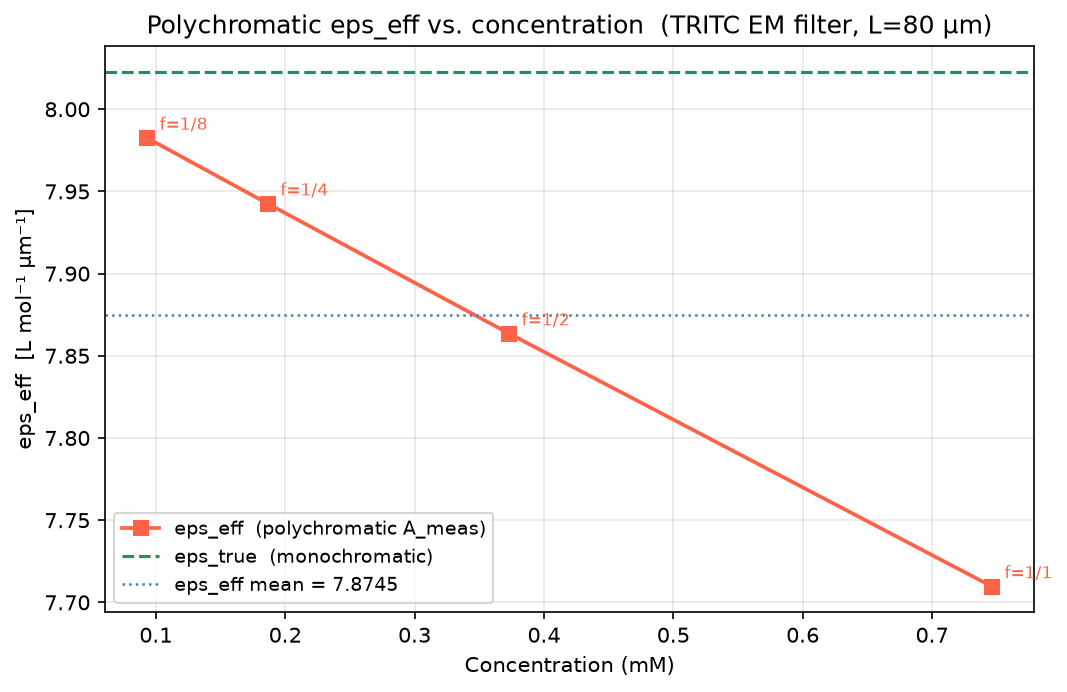
Inverting Beer-Lambert using $A_\text{meas}$ gives the apparent $\varepsilon_\text{eff}$ that an experimenter would infer. Because $A_\text{meas} < A_\text{naive}$, $\varepsilon_\text{eff}$ underestimates the true $\varepsilon$ and decreases with increasing concentration.
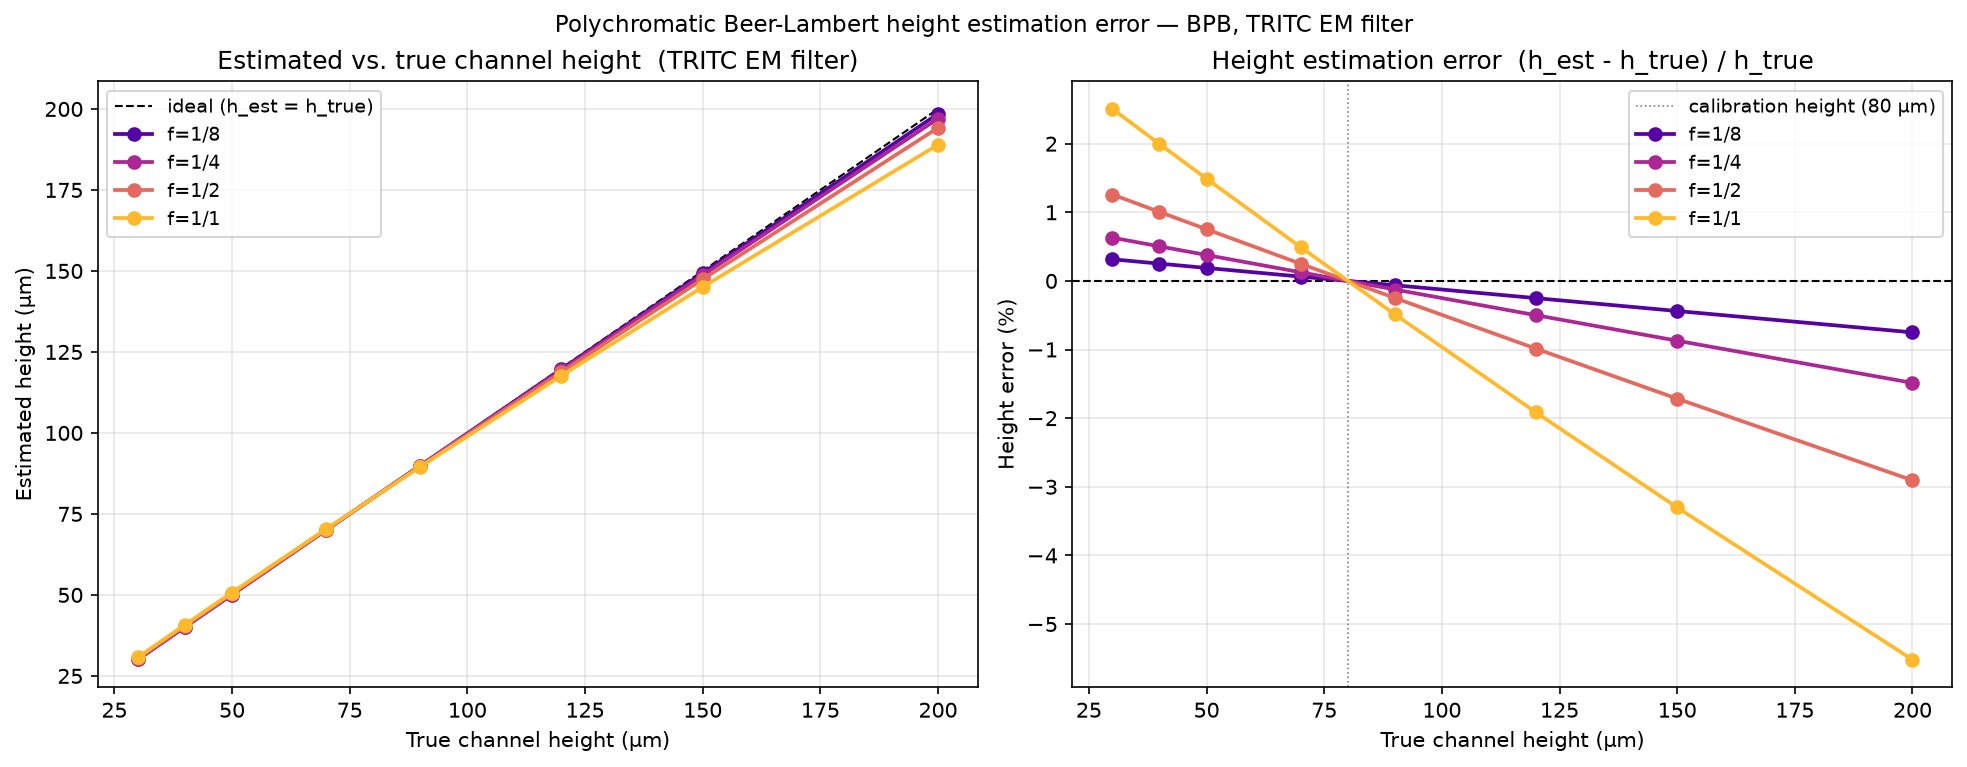
Computing $A_\text{meas}(f, \ell)$ across stepped-channel heights $\ell \in \{30, 40, 50, 70, 90, 120, 150, 200\}$ µm and inverting Beer-Lambert with $\varepsilon_\text{eff}$ calibrated at $\ell = 80$ µm shows how the polychromatic error propagates into height estimates. At heights above the calibration point the error is negative (underestimate); below it the error is positive (overestimate).
| Height (µm) | f=1/8 — 0.093 mM | f=1/4 — 0.187 mM | f=1/2 — 0.373 mM | f=1/1 — 0.746 mM |
|---|---|---|---|---|
| 30 | 0.0224 | 0.0447 | 0.0891 | 0.1769 |
| 40 | 0.0299 | 0.0596 | 0.1186 | 0.2347 |
| 50 | 0.0373 | 0.0744 | 0.1478 | 0.2920 |
| 70 | 0.0522 | 0.1039 | 0.2059 | 0.4047 |
| 90 | 0.0670 | 0.1332 | 0.2634 | 0.5153 |
| 120 | 0.0891 | 0.1769 | 0.3486 | 0.6772 |
| 150 | 0.1112 | 0.2203 | 0.4326 | 0.8346 |
| 200 | 0.1478 | 0.2920 | 0.5698 | 1.0872 |
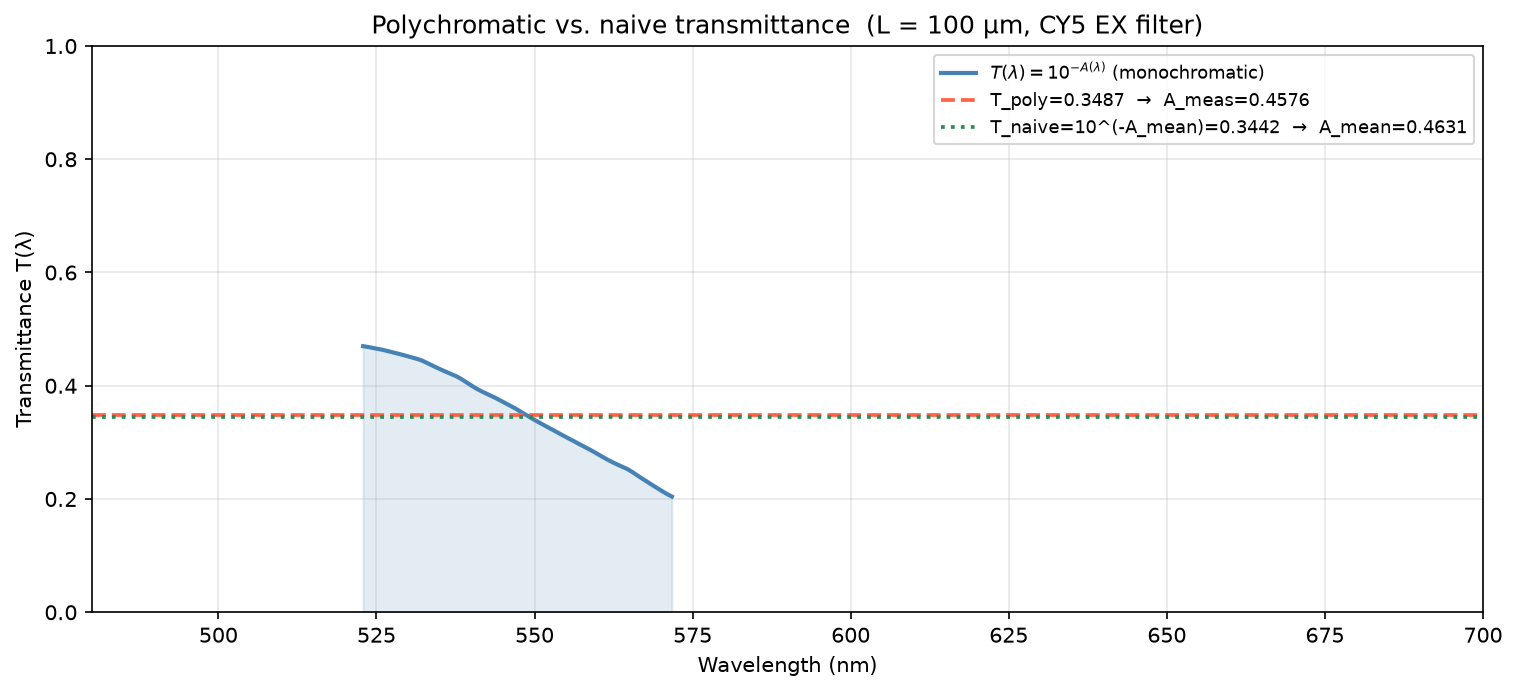
The same polychromatic analysis as Section 5, but using the CY5 EX excitation filter in place of the TRITC EM emission filter.
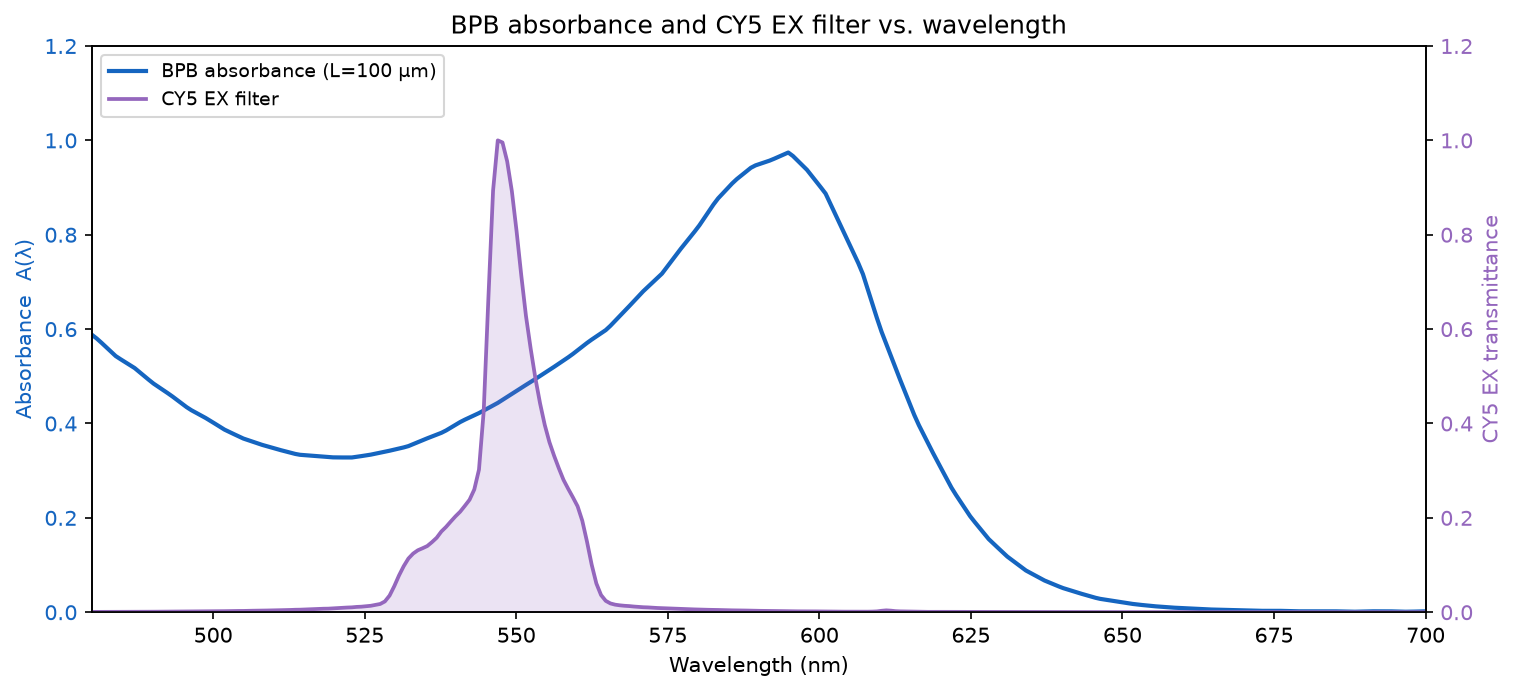
Computing $T_\text{poly}$ and comparing it to the naive $T_\text{naive} = 10^{-\langle A \rangle}$ quantifies the magnitude of the polychromatic error at the Nanodrop measurement path length.
Scaling the BPB absorbance by concentration fraction $f \in \{1/8, 1/4, 1/2, 1\}$ at the 80 µm capillary path length shows how $A_\text{meas}$ diverges from the linear Beer-Lambert prediction as the total absorbance product $\varepsilon c \ell$ increases.
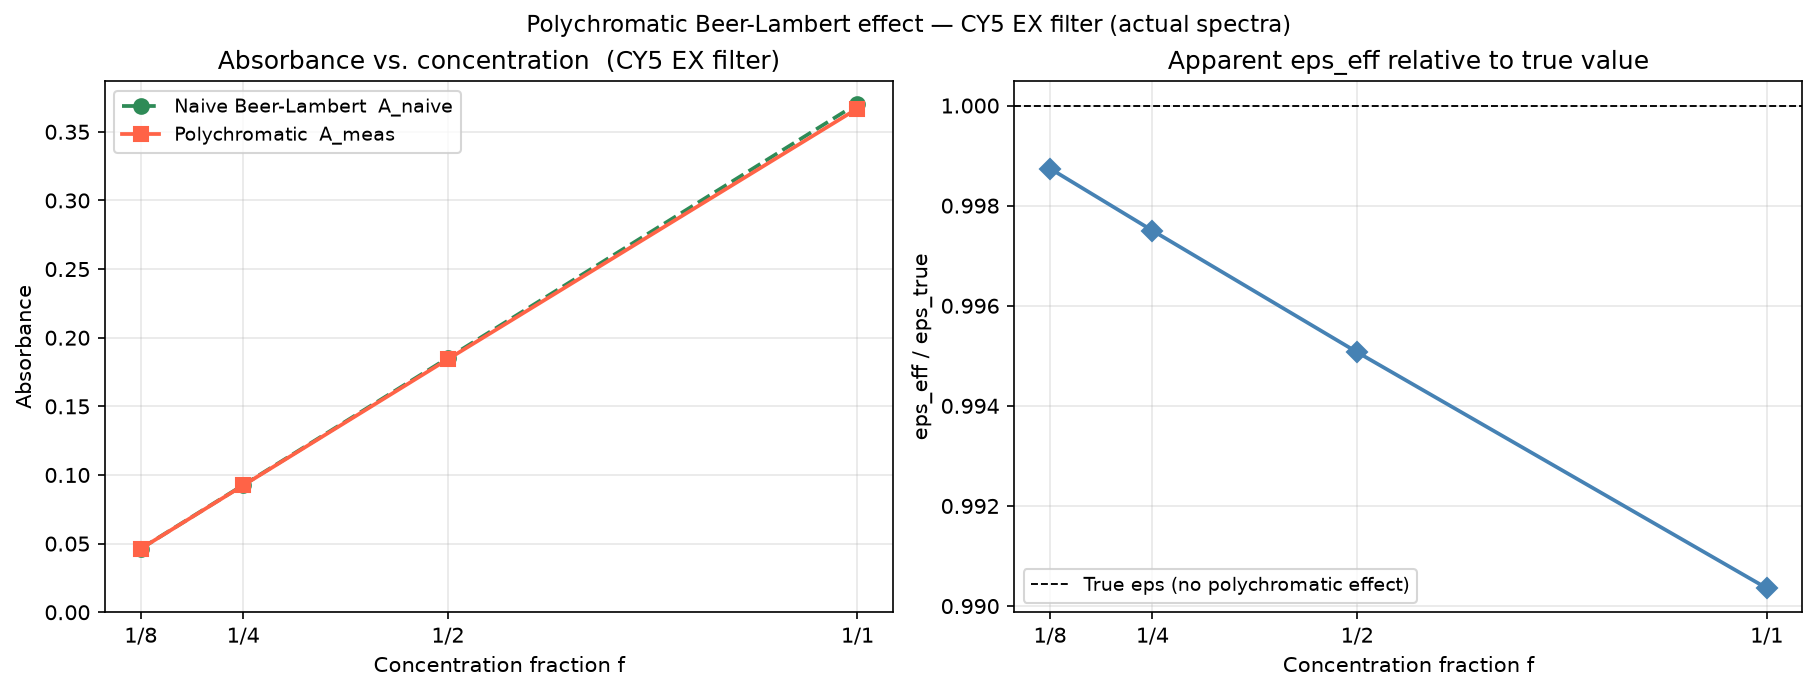
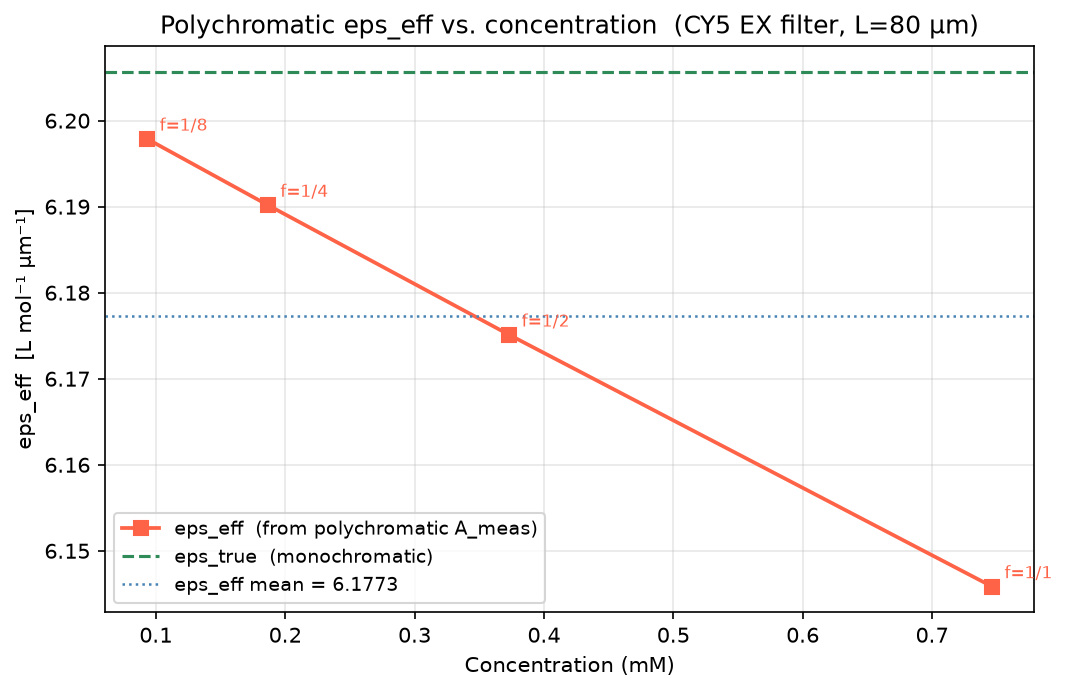
Inverting Beer-Lambert using $A_\text{meas}$ gives the apparent $\varepsilon_\text{eff}$ that an experimenter would infer. Because $A_\text{meas} < A_\text{naive}$, $\varepsilon_\text{eff}$ underestimates the true $\varepsilon$ and decreases with increasing concentration.
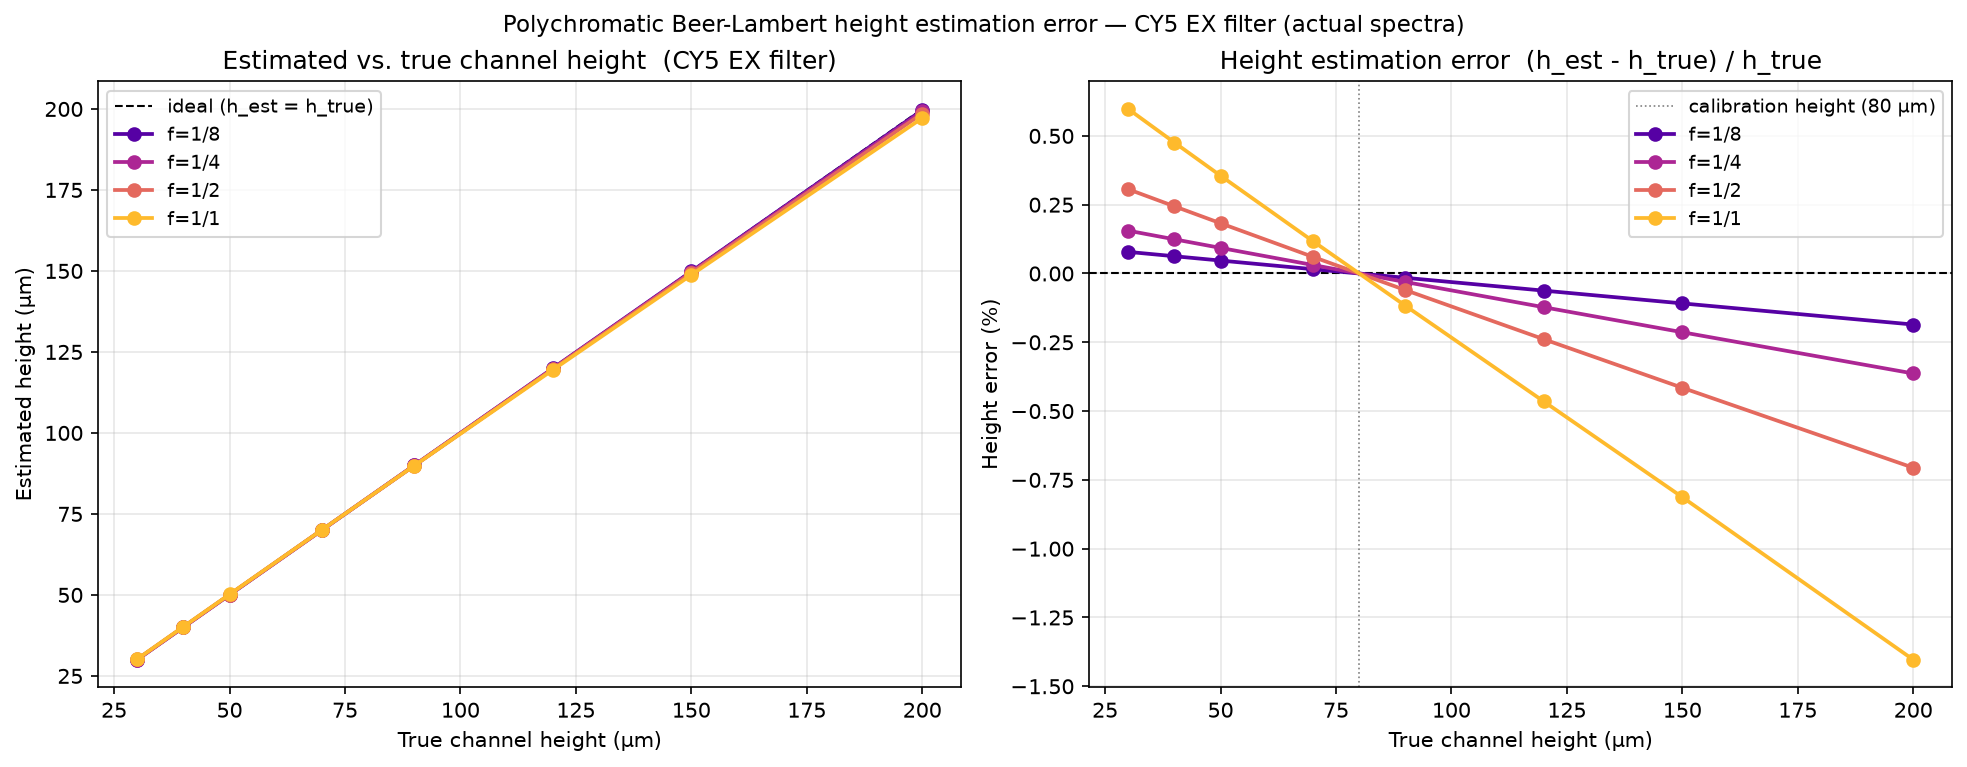
Computing $A_\text{meas}(f, \ell)$ across stepped-channel heights $\ell \in \{30, 40, 50, 70, 90, 120, 150, 200\}$ µm and inverting Beer-Lambert with $\varepsilon_\text{eff}$ (calibrated at $\ell = 80$ µm) shows how the polychromatic error propagates into height estimates. At heights above the calibration point the error is negative (underestimate); below it the error is positive (overestimate).
| Height (µm) | f=1/8 — 0.093 mM | f=1/4 — 0.187 mM | f=1/2 — 0.373 mM | f=1/1 — 0.746 mM |
|---|---|---|---|---|
| 30 | 0.0174 | 0.0347 | 0.0693 | 0.1384 |
| 40 | 0.0231 | 0.0463 | 0.0924 | 0.1843 |
| 50 | 0.0289 | 0.0578 | 0.1154 | 0.2302 |
| 70 | 0.0405 | 0.0809 | 0.1614 | 0.3214 |
| 90 | 0.0520 | 0.1039 | 0.2073 | 0.4123 |
| 120 | 0.0693 | 0.1384 | 0.2759 | 0.5478 |
| 150 | 0.0866 | 0.1729 | 0.3442 | 0.6824 |
| 200 | 0.1154 | 0.2302 | 0.4576 | 0.9045 |
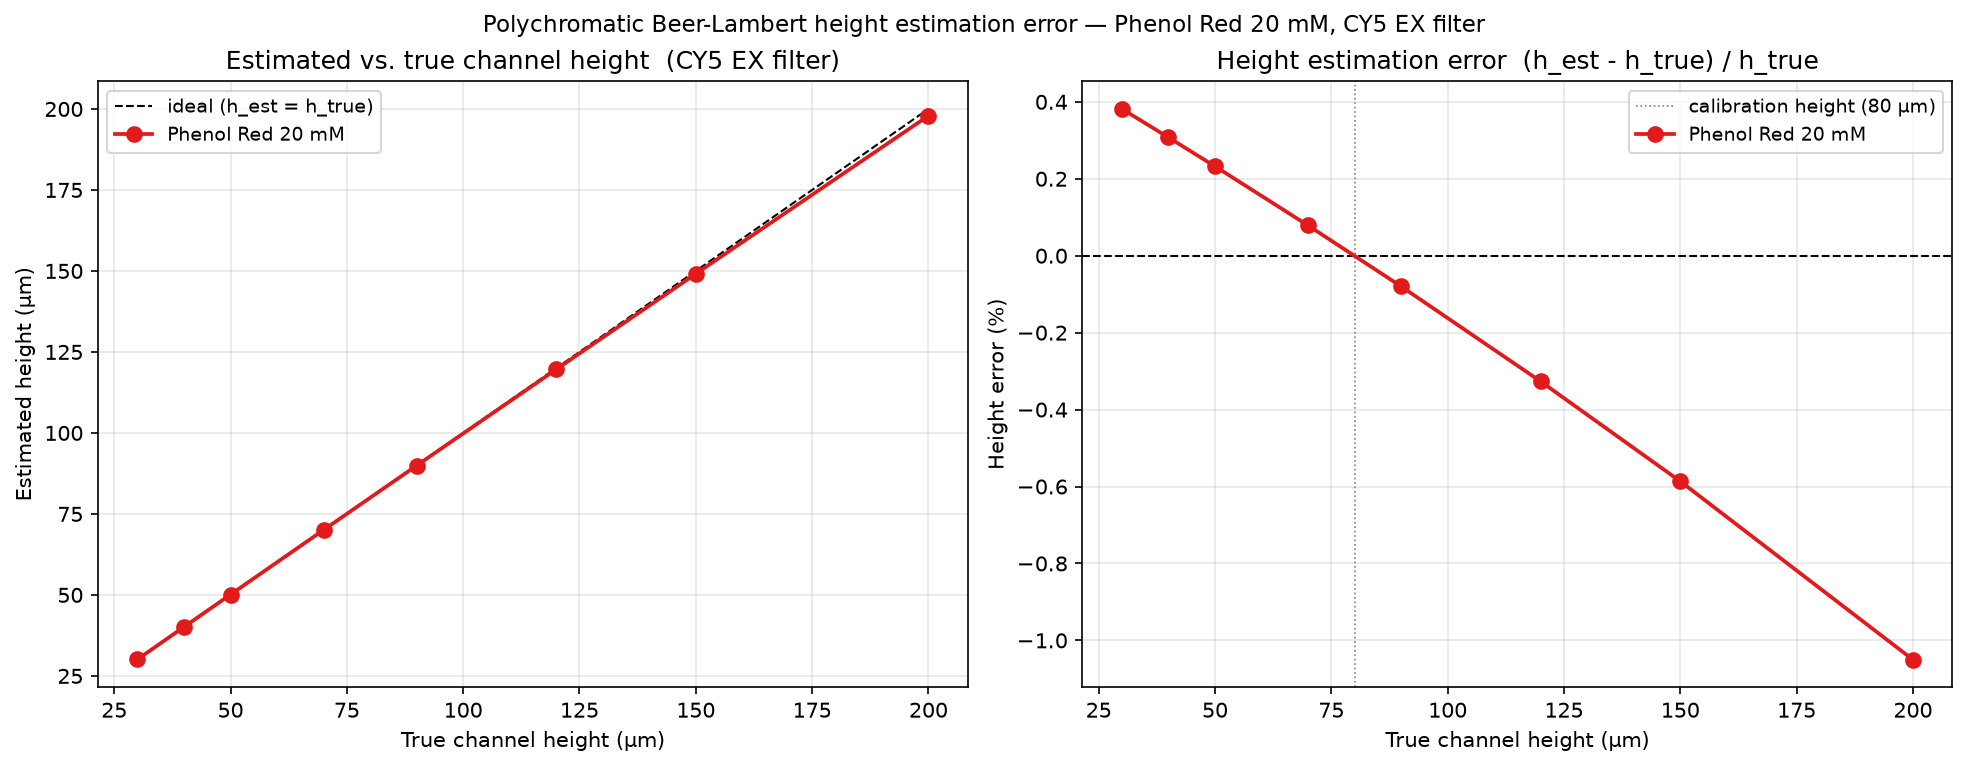
The same polychromatic analysis applied to the Phenol Red spectrum at 20 mM urea. Unlike BPB — whose absorbance scales linearly with concentration — Phenol Red's spectrum changes shape with pH (driven by the urea-urease reaction), so path-length scaling is the only valid way to vary absorbance for a fixed sample composition. Height estimates are calibrated by the ratio method at 80 µm without requiring knowledge of the molar concentration.
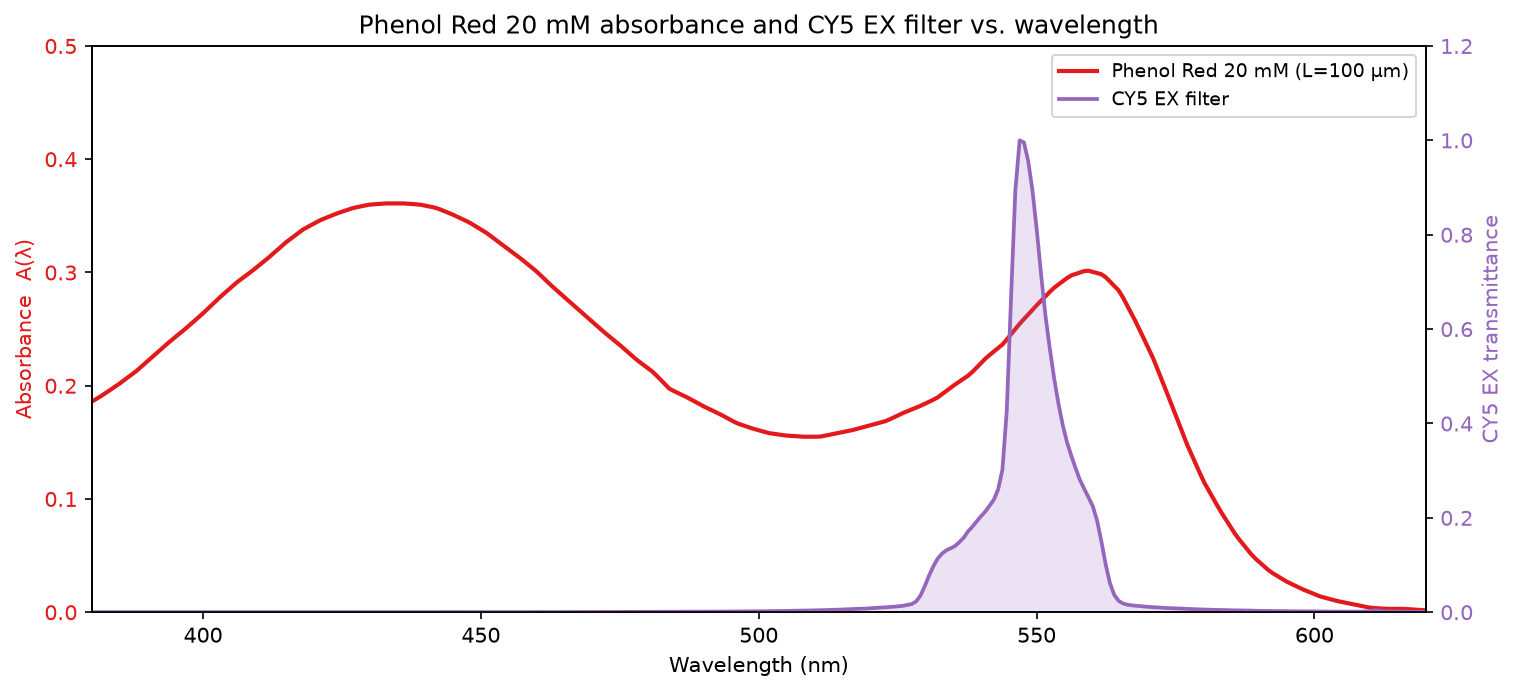
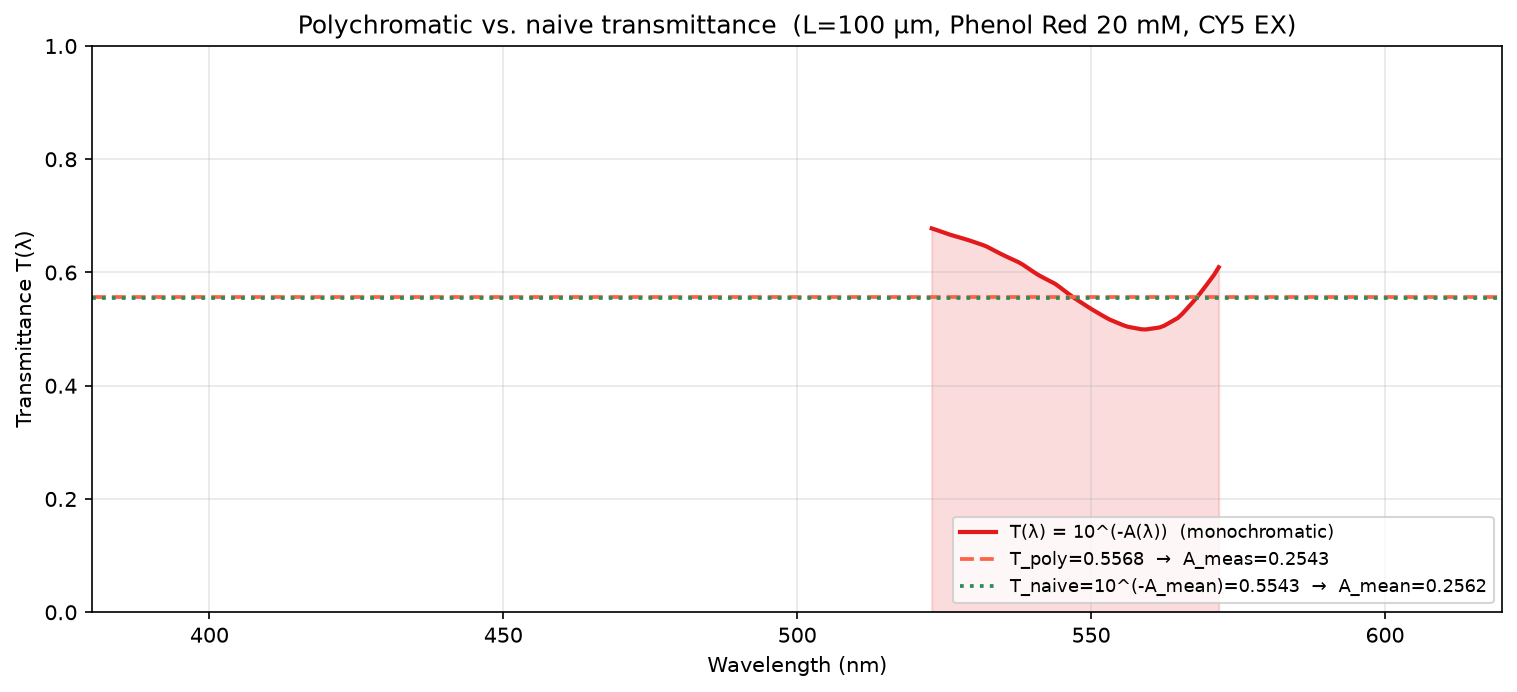
Scaling the Phenol Red absorbance by path fraction $f$ (equivalent to measuring at different channel heights as a fraction of the 100 µm reference) illustrates the polychromatic deviation across the relevant height range.
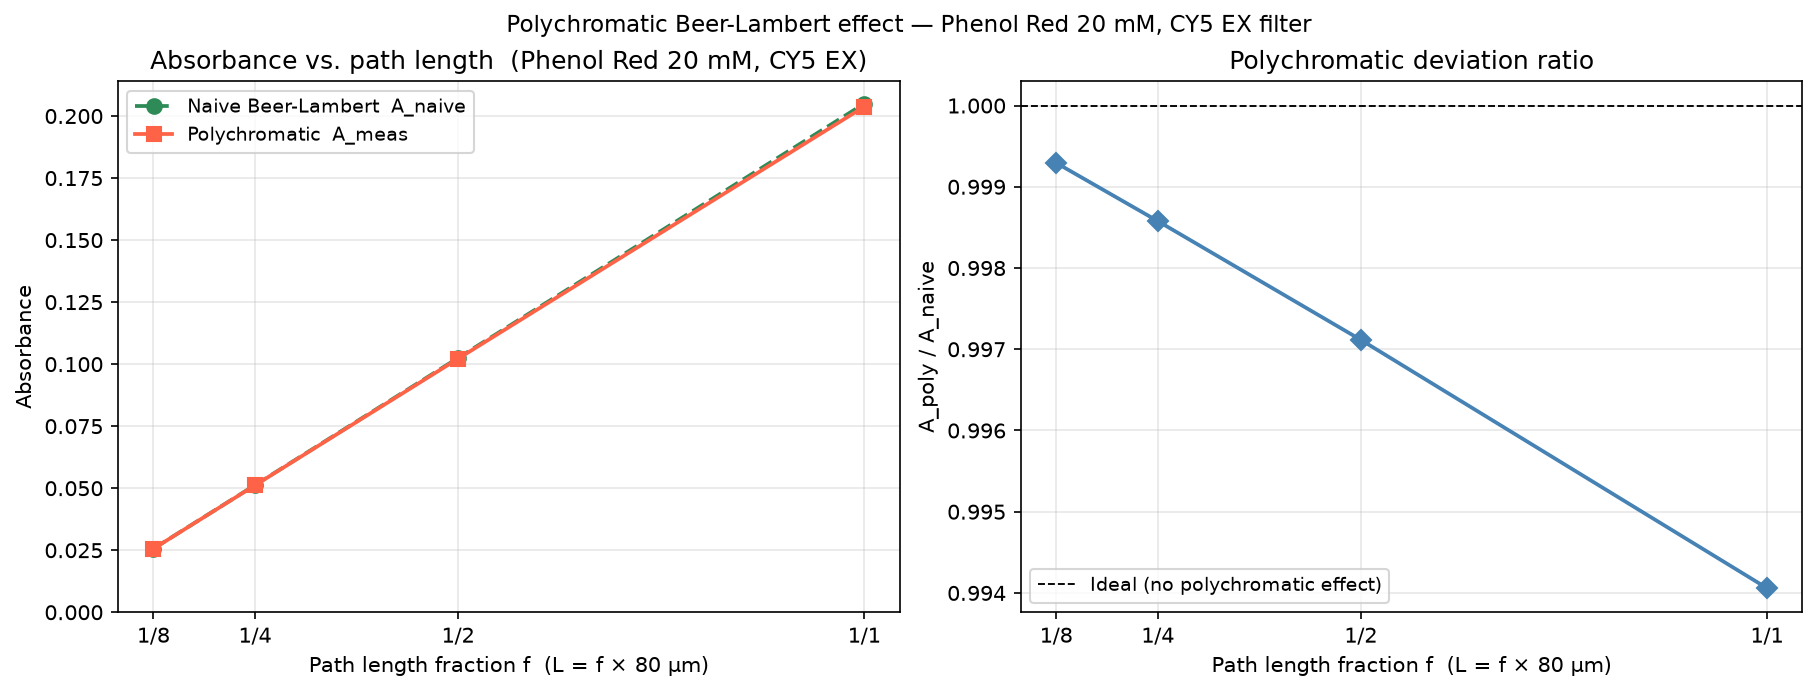
Ratio-based height estimation calibrated at 80 µm: $h_\text{est} = 80\,\mu\text{m} \times A_\text{meas}(\ell) / A_\text{meas}(80\,\mu\text{m})$. The error reflects the polychromatic non-linearity: weakly absorbing heights are overestimated and strongly absorbing heights are underestimated relative to the calibration point.