Empirical Beer–Lambert analysis of stepped-height microfluidic channel images acquired 2026-08-31 with 5 Allura Red concentrations (0.375, 1.0, 1.5, 2.5, 5.0 mM).
Transmittance:
Absorbance:
Forward model (empirical Beer–Lambert):
No Nanodrop spectrum or filter profile is used. The scale s absorbs all unknown proportionality factors (molar absorptivity, filter efficiency, camera sensitivity) and is determined purely from the capillary at known path length L = 80 µm.
The capillary (L = 80 µm, known path length) is used to compare measured absorbance for the green and blue camera channels against a purely linear Beer–Lambert model (no nonlinearity correction, no free parameters). Whichever channel shows smaller residuals is selected for all subsequent stages.
| Conc (mM) | A_green | A_blue | A_linear | res_green | res_blue | σ_green | σ_blue |
|---|---|---|---|---|---|---|---|
| 0.375 | 0.0276 | 0.0212 | 0.0243 | +0.0033 | -0.0016 | 0.0052 | 0.0141 |
| 1 | 0.0708 | 0.0682 | 0.0648 | +0.0060 | +0.0073 | 0.0057 | 0.0172 |
| 1.5 | 0.1026 | 0.0969 | 0.0972 | +0.0054 | +0.0056 | 0.0061 | 0.0184 |
| 2.5 | 0.1674 | 0.1389 | 0.1620 | +0.0054 | -0.0133 | 0.0070 | 0.0209 |
| 5 | 0.3182 | 0.3080 | 0.3240 | -0.0058 | +0.0036 | 0.0105 | 0.0338 |
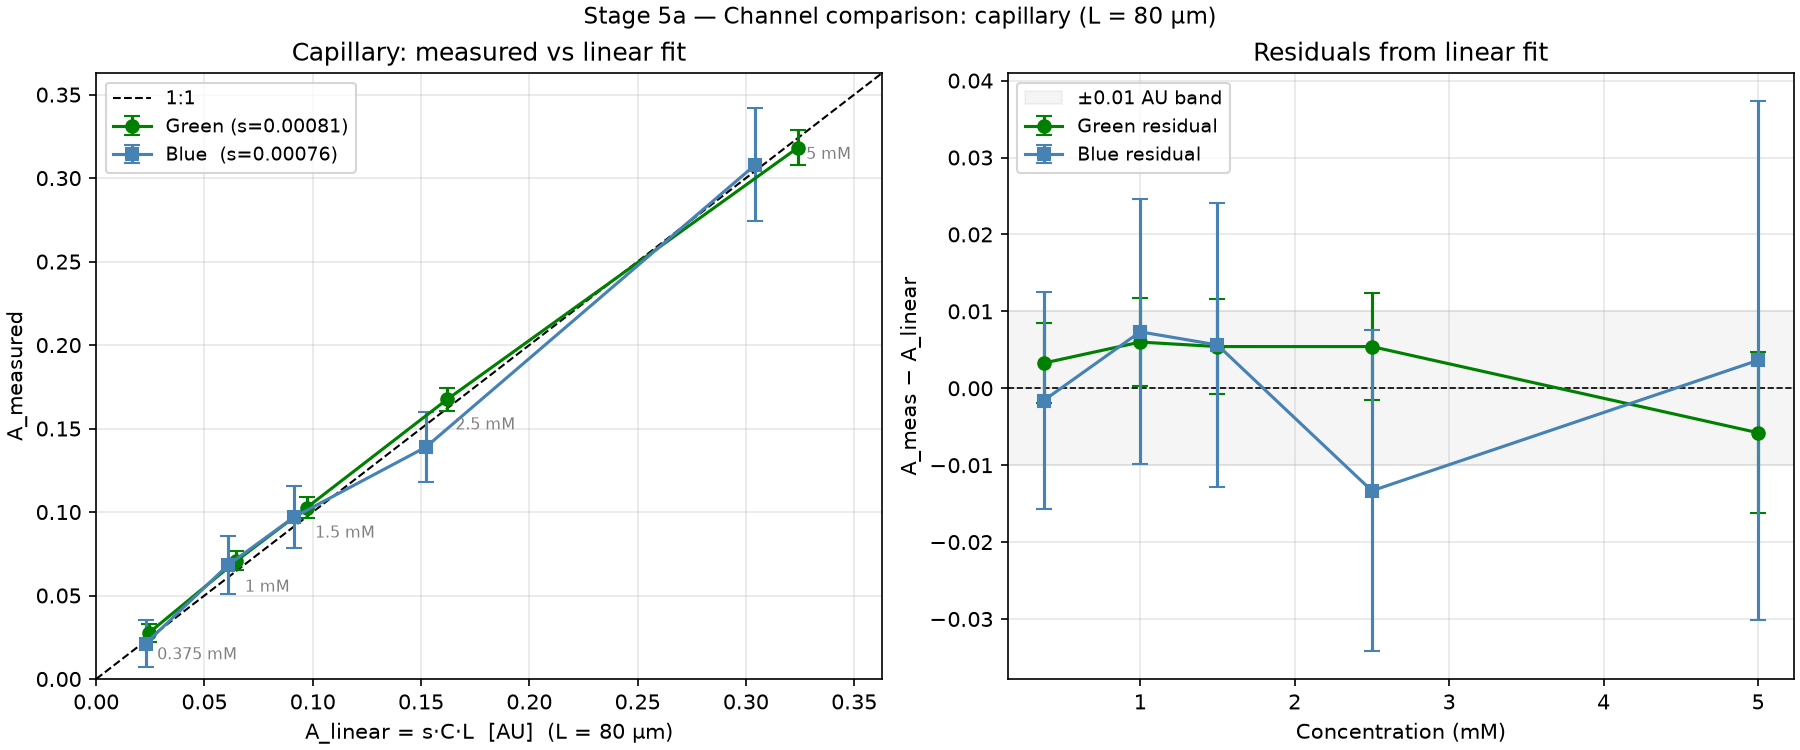
Left: measured vs linear-fit absorbance for both channels at the capillary. Right: residuals from the linear fit. Systematic curvature in both channels indicates mild nonlinearity that is accounted for in Stage 6.
The effective absorptivity scale s [AU/(mM·µm)] and camera nonlinearity parameter η are fit jointly from the 5 capillary measurements at known L = 80 µm using Nelder–Mead minimisation.
s anchors the absolute path-length scale for all subsequent stages — knowing L = 80 µm exactly is what lets us convert from absorbance to height. η captures the systematic deviation from strict linearity; at the highest capillary condition (5 mM × 80 µm = 400 mM·µm) the correction is -8.44%.
| Parameter | Value | Interpretation |
|---|---|---|
| s | 0.0008683 AU/(mM·µm) | effective absorptivity scale |
| η | -0.02111 | camera nonlinearity (0 = linear) |
| RMS residual | 0.00090 AU | over 5 capillary measurements |
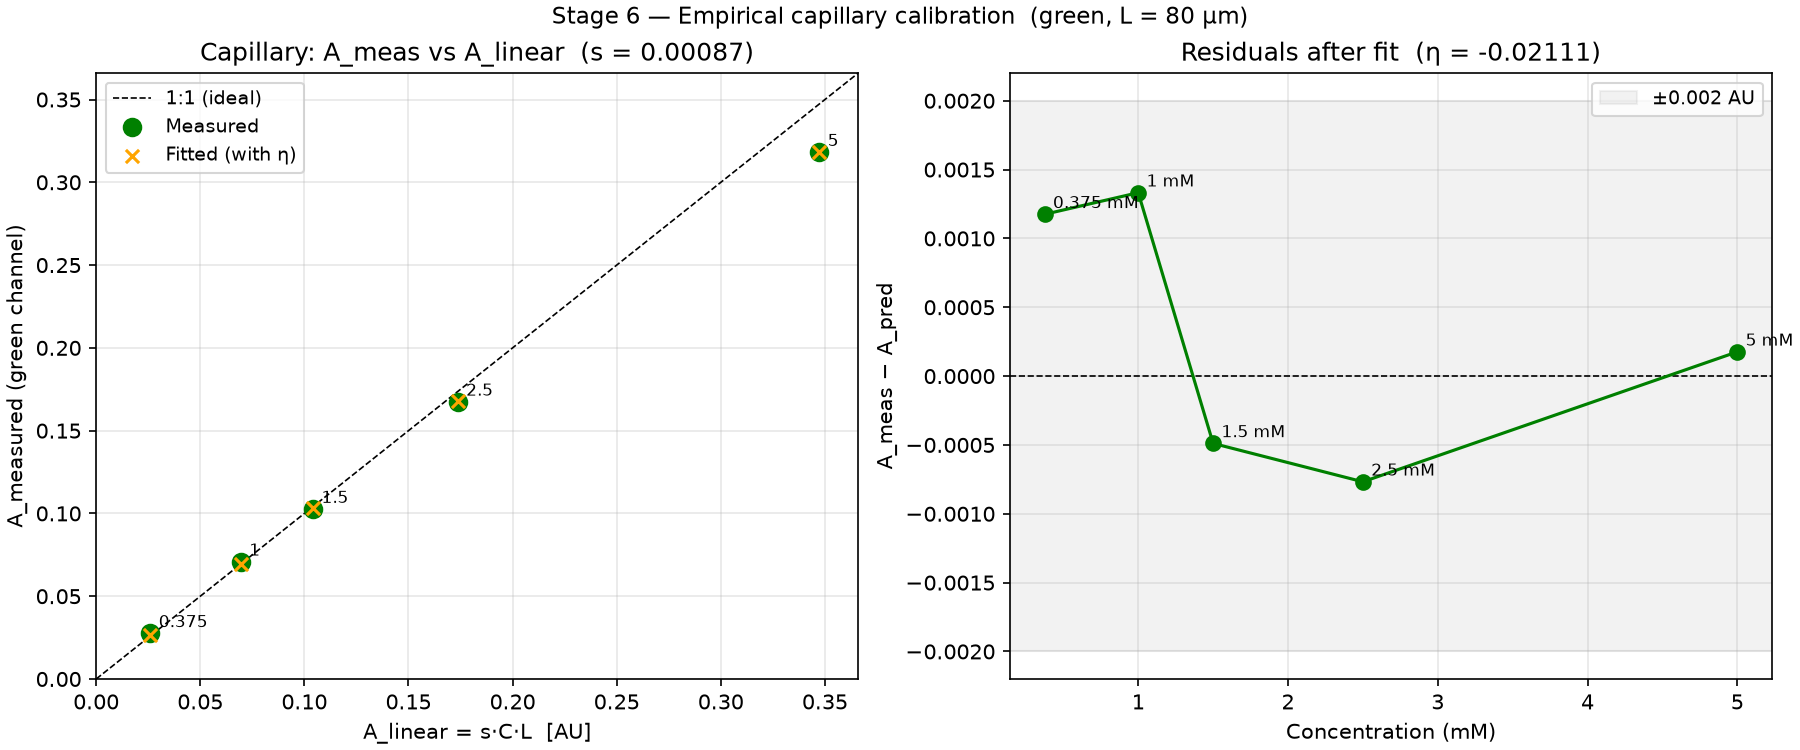
Left: measured absorbance vs linear prediction for the green channel; the small positive deviation at high concentrations reflects η > 0. Right: residuals after fitting both s and η — the curve is removed and residuals are near zero.
The 8 section heights hi and the nonlinearity η are fit jointly from the full 8×5 channel absorbance matrix (8 sections × 5 concentrations = 40 measurements), using s from Stage 6 to anchor the absolute scale.
Degrees of freedom: 40 measurements − 9 unknowns (8 hi + η) = 31 DoF. The 6.7× concentration span (0.375–5 mM) gives strong leverage on η because it produces a wide absorbance range; s from Stage 6 anchors the absolute height scale.
| Section | h_nominal (µm) | h_fit (µm) | h_fit / h_nom |
|---|---|---|---|
| 30um | 30 | 28.47 | 0.9490 |
| 40um | 40 | 38.17 | 0.9543 |
| 50um | 50 | 48.18 | 0.9636 |
| 70um | 70 | 67.07 | 0.9581 |
| 90um | 90 | 86.74 | 0.9638 |
| 120um | 120 | 117.32 | 0.9777 |
| 150um | 150 | 151.06 | 1.0071 |
| 200um | 200 | 212.74 | 1.0637 |
s = 0.0008683 AU/(mM·µm) — Stage 6 capillary (fixed)
η_cap = -0.02111 — Stage 6, capillary-only fit
η_fit = -0.03570 — Stage 7, from 6.7× channel concentration span
RMS = 0.00685 AU over 40 channel measurements (31 DoF)
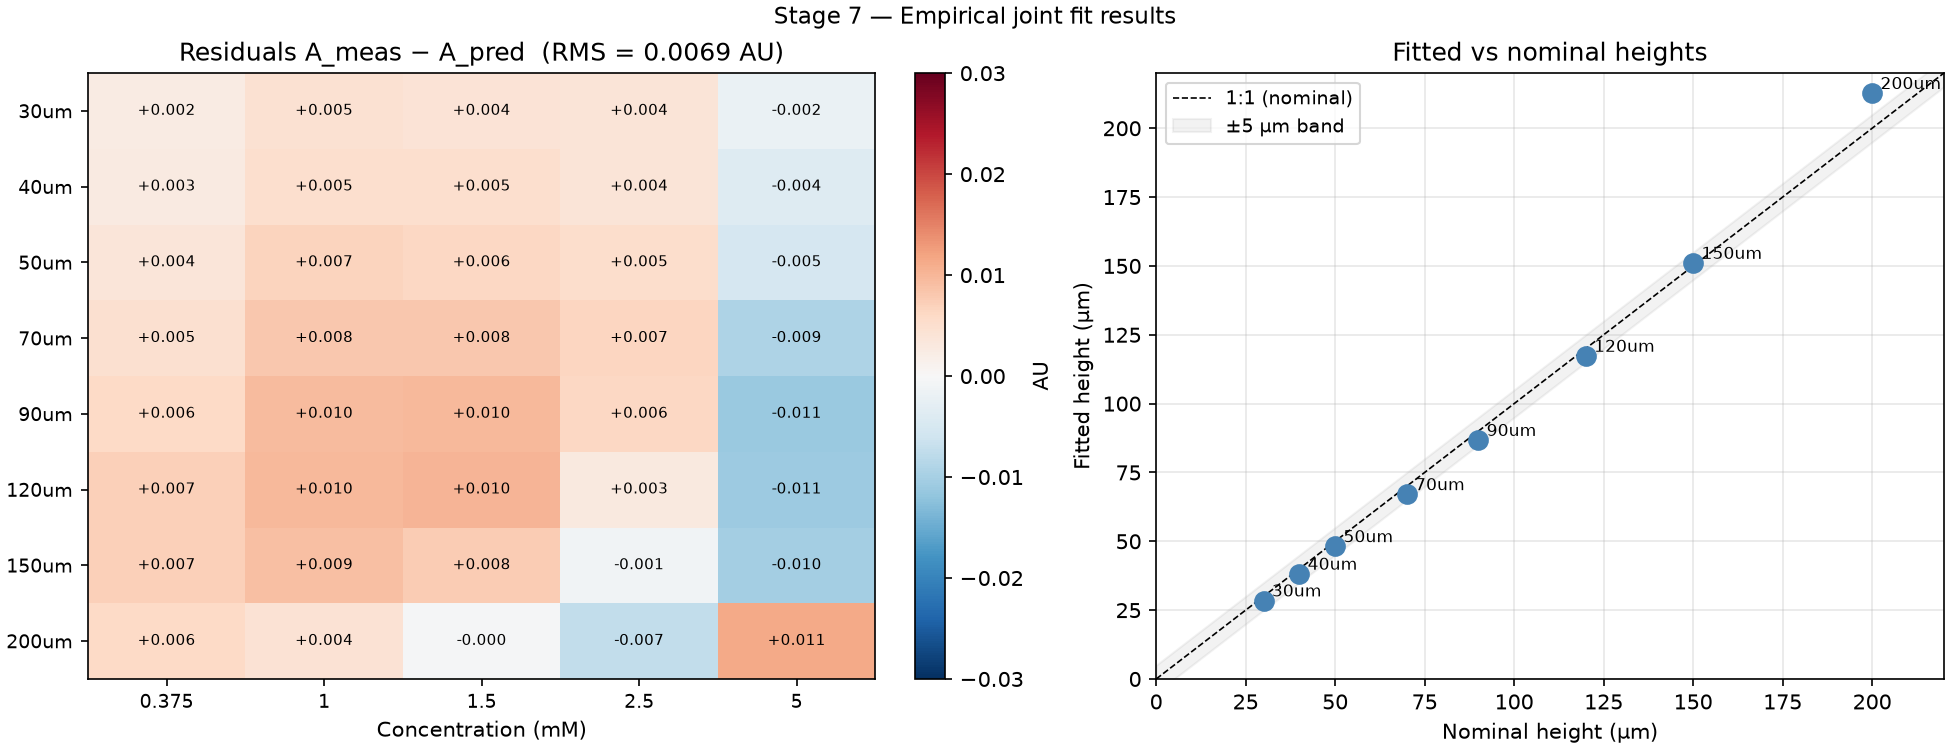
Left: residual heatmap (A_meas − A_pred). Blue = model overpredicts; red = model underpredicts. A systematic negative column at 5 mM is visible. Right: fitted vs nominal heights; all sections agree within a few µm except 200 µm, which lands at 212.7 µm.
Anomaly: the Stage 7 free fit places the 200 µm section at 212.7 µm, roughly 6% above the 200 ± 1 µm confirmed by direct measurement. All other sections (30–150 µm) fall within a few percent of their nominal depths. The residual heatmap also shows a systematic negative bias in the 5 mM column for all sections except 200 µm. Three sensitivity tests below investigate whether this reflects model error, a concentration outlier, or a true depth discrepancy.
The 5 mM column shows a clear systematic pattern in the residual heatmap: negative residuals for all sections except 200 µm (positive). One hypothesis is that the empirical quadratic correction extrapolates poorly to the highest Ch products (up to 1000 mM·µm at 5 mM × 200 µm, vs the capillary calibration pivot of 80 mM·µm). This test repeats the fit using only the four lower concentrations (0.375, 1.0, 1.5, 2.5 mM), reducing the maximum Ch to 500 mM·µm.
Degrees of freedom: 4 × 8 = 32 measurements − 9 unknowns = 23 DoF.
| Section | h_nom (µm) | h_5c (µm) | h_4c (µm) | Δh (µm) | h_5c/h_nom | h_4c/h_nom |
|---|---|---|---|---|---|---|
| 30um | 30 | 28.47 | 30.25 | +1.78 | 0.9490 | 1.0084 |
| 40um | 40 | 38.17 | 40.69 | +2.51 | 0.9543 | 1.0171 |
| 50um | 50 | 48.18 | 51.64 | +3.46 | 0.9636 | 1.0328 |
| 70um | 70 | 67.07 | 72.72 | +5.65 | 0.9581 | 1.0389 |
| 90um | 90 | 86.74 | 93.88 | +7.14 | 0.9638 | 1.0431 |
| 120um | 120 | 117.32 | 125.55 | +8.23 | 0.9777 | 1.0463 |
| 150um | 150 | 151.06 | 160.74 | +9.68 | 1.0071 | 1.0716 |
| 200um | 200 | 212.74 | 224.87 | +12.13 | 1.0637 | 1.1243 |
5-conc fit: η = -0.03570, RMS = 0.00685 AU (40 meas, 31 DoF)
4-conc fit: η = -0.04446, RMS = 0.00278 AU (32 meas, 23 DoF)
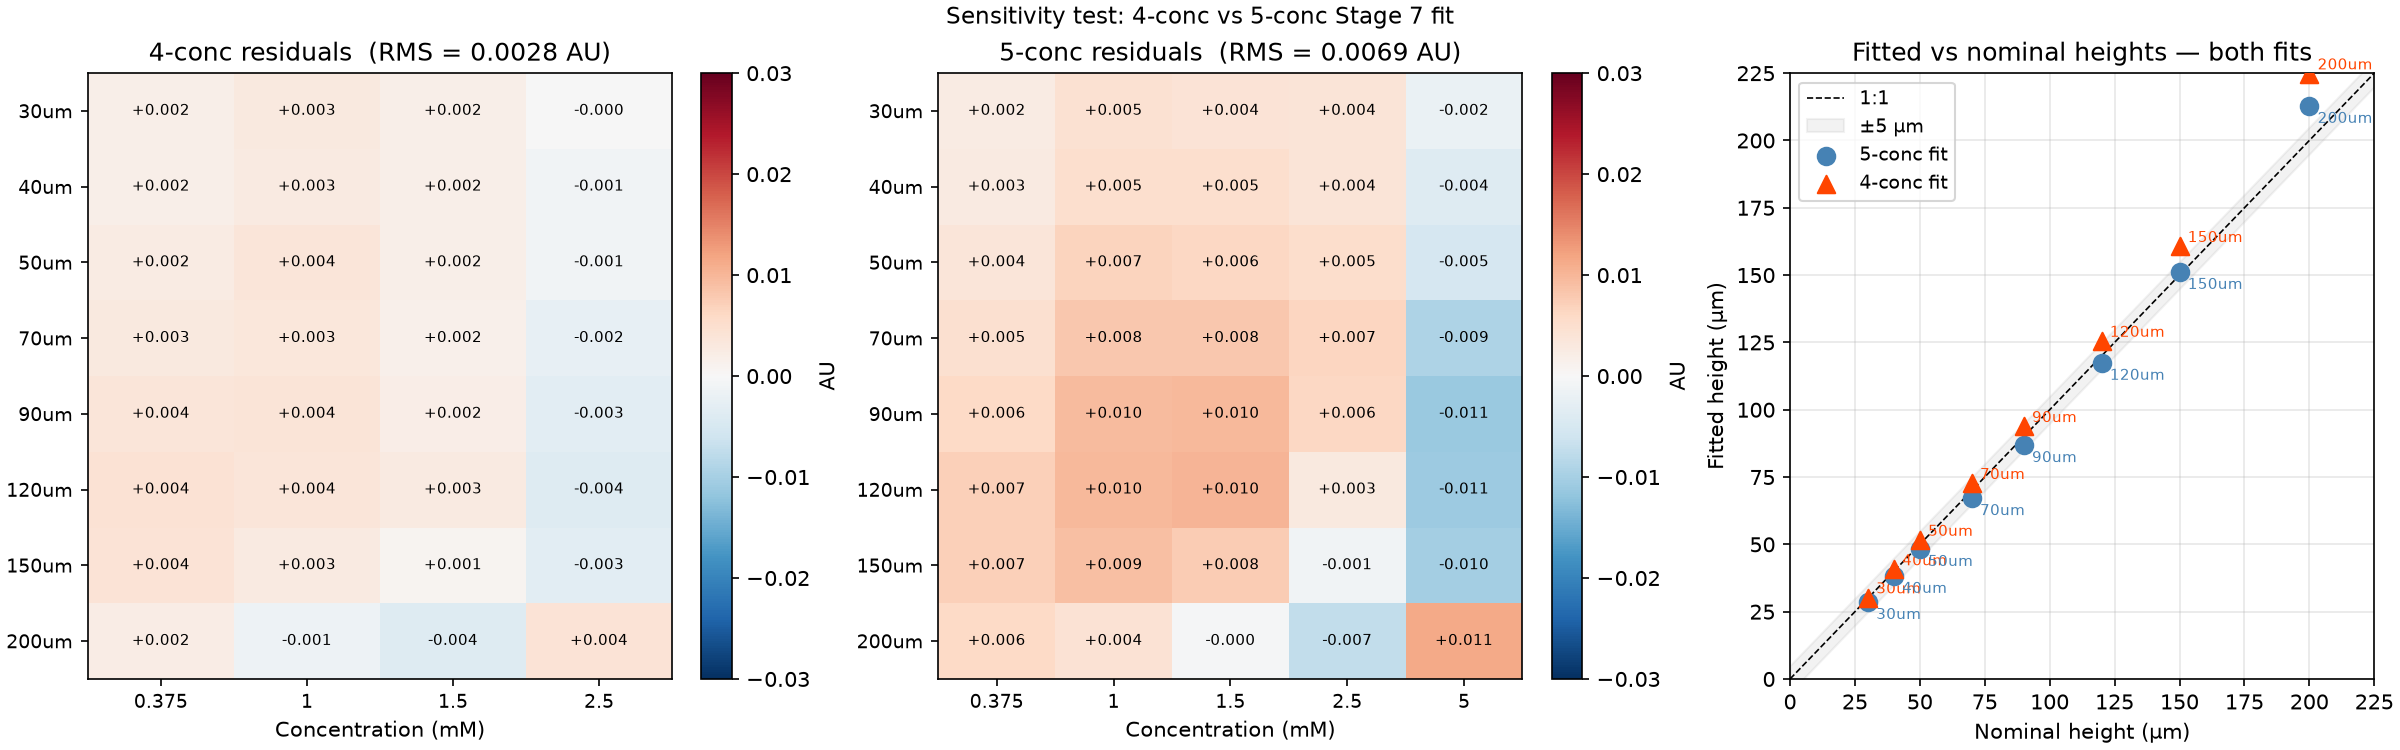
Left: 4-conc residuals. Centre: 5-conc residuals for comparison. Right: fitted heights for both fits — orange triangles (4-conc) sit systematically above blue circles (5-conc) for every section, including 200 µm.
A note on concentration errors and the dilution series. All five concentrations were prepared by diluting the same 5 mM stock solution. Any error in the stock propagates as the same relative factor to every concentration. A uniform scale factor on all concentrations aliases exactly through s and cannot produce a column-specific residual pattern. The 5 mM column's systematic negative residuals therefore cannot be explained by a stock error; they point to model inadequacy at large Ch products.
This test pins h_200 = 200 µm from direct measurement and re-fits the remaining 7 heights and η from all 40 channel measurements.
Degrees of freedom: 40 measurements − 8 unknowns (7 hi + η) = 32 DoF.
| Section | h_nom (µm) | h_free (µm) | h_fix (µm) | Δh (µm) | h_free/h_nom | h_fix/h_nom |
|---|---|---|---|---|---|---|
| 30um | 30 | 28.47 | 28.45 | -0.02 | 0.9490 | 0.9485 |
| 40um | 40 | 38.17 | 38.13 | -0.04 | 0.9543 | 0.9534 |
| 50um | 50 | 48.18 | 48.10 | -0.08 | 0.9636 | 0.9620 |
| 70um | 70 | 67.07 | 66.89 | -0.18 | 0.9581 | 0.9555 |
| 90um | 90 | 86.74 | 86.39 | -0.36 | 0.9638 | 0.9599 |
| 120um | 120 | 117.32 | 116.54 | -0.78 | 0.9777 | 0.9712 |
| 150um | 150 | 151.06 | 149.57 | -1.49 | 1.0071 | 0.9972 |
| 200um | 200 | 212.74 | 200.00 ← fixed | -12.74 | 1.0637 | 1.0000 (fixed) |
Free fit: η = -0.03570, RMS = 0.00685 AU (40 meas, 31 DoF)
Fixed h_200: η = -0.03487, RMS = 0.00773 AU (40 meas, 32 DoF)
The 200 µm row residuals (blue annotations in centre heatmap) reveal whether the
measured absorbances there are consistent with h = 200 µm under the fitted η.
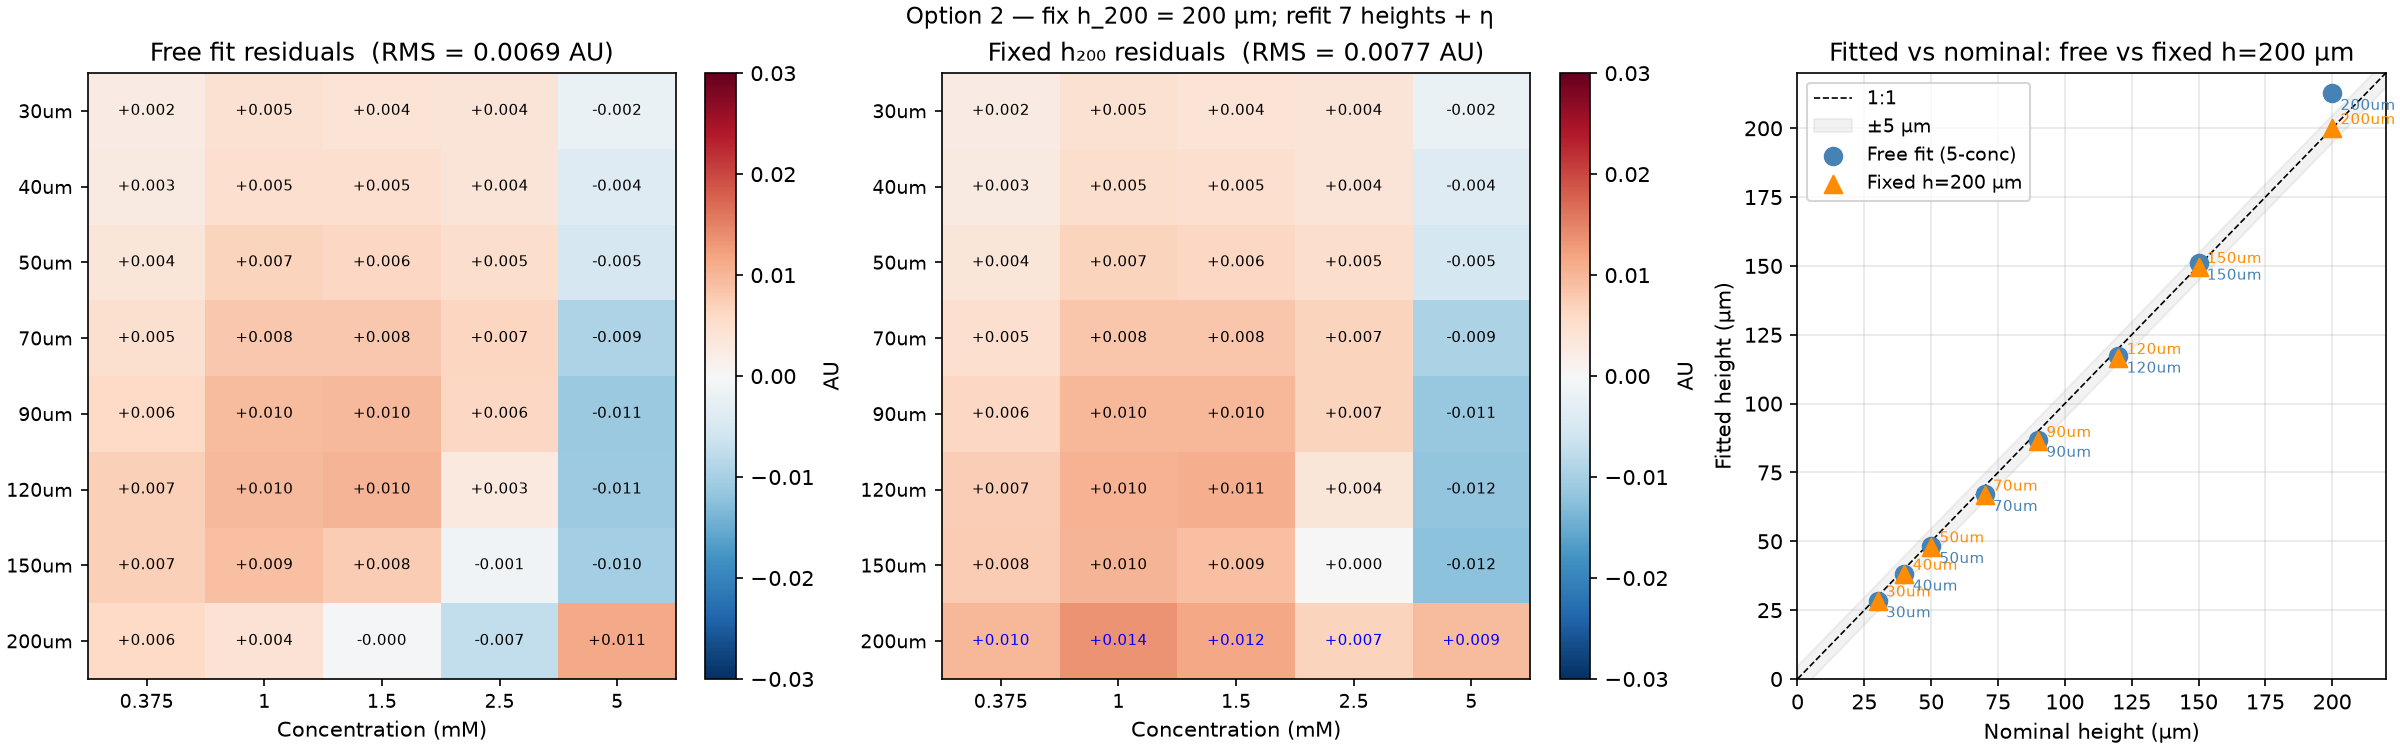
Left: free-fit residuals. Centre: fixed-h_200 residuals (200 µm row annotated in blue). Right: height comparison — orange triangles (fixed) coincide with blue circles (free) for all sections except 200 µm.
What if we ignore the capillary calibration entirely and let s float as a free parameter, anchored instead by pinning h_200 = 200 µm from direct measurement?
Scale degeneracy: Beer–Lambert absorbance depends on the product s·C·h. Scaling s by k and all heights by 1/k leaves every prediction unchanged — the fit is under-determined without an anchor. Pinning h_200 = 200 µm breaks this degeneracy: the absolute height scale is now set by the direct measurement, not by the capillary.
Free parameters: s, η, and h30–h150 (7 heights) — 9 unknowns from 40 measurements → 31 DoF (same as Stage 7, but capillary data play no role).
Comparing the fitted snocap to semp from the capillary quantifies how much the two anchoring methods agree on the absolute absorptivity scale.
| Section | h_nom (µm) | h_free (µm) | h_fix200 (µm) | h_nocap (µm) | nocap/nom |
|---|---|---|---|---|---|
| 30um | 30 | 28.47 | 28.45 | 26.77 | 0.8922 |
| 40um | 40 | 38.17 | 38.13 | 35.89 | 0.8972 |
| 50um | 50 | 48.18 | 48.10 | 45.29 | 0.9059 |
| 70um | 70 | 67.07 | 66.89 | 63.05 | 0.9008 |
| 90um | 90 | 86.74 | 86.39 | 81.55 | 0.9061 |
| 120um | 120 | 117.32 | 116.54 | 110.30 | 0.9191 |
| 150um | 150 | 151.06 | 149.57 | 142.02 | 0.9468 |
| 200um | 200 | 212.74 | 200.00 | 200.00 ← fixed | 1.0000 (fixed) |
Free fit (Stage 7): s = 0.0008683 AU/(mM·µm), η = -0.03570, RMS = 0.00685 AU
Fix h_200 (Option 2): s = 0.0008683 AU/(mM·µm), η = -0.03487, RMS = 0.00773 AU
Channel-only: s = 0.0009215 AU/(mM·µm), η = -0.03806, RMS = 0.00685 AU
The ratio s_nocap / s_emp = 1.0613 — the two anchoring methods
disagree on the absolute scale by 6.1%.
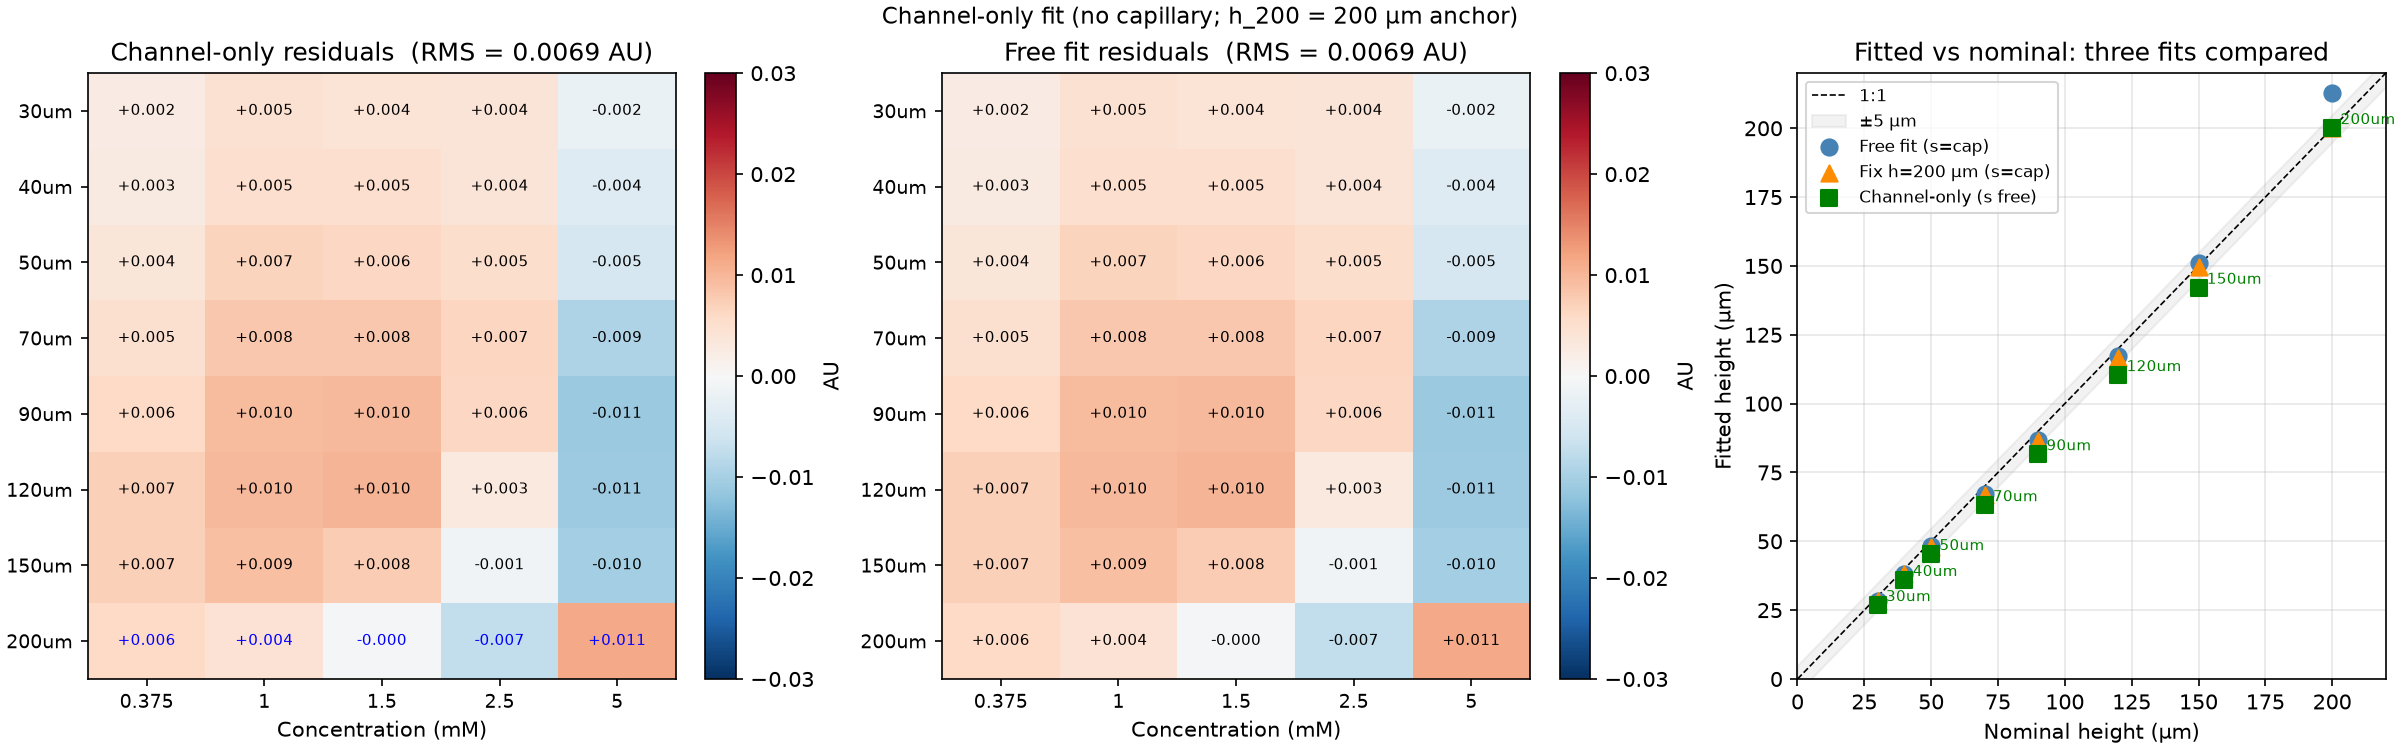
Left: channel-only residuals (200 µm row in blue). Centre: free-fit residuals for comparison. Right: all three fits on the same height scatter plot — green squares (channel-only) sit systematically below blue circles (free fit with capillary anchor).
The Keyence confocal distance sensor directly measured three section heights. All three are above their nominal depths, consistent with the Stage 7 free-fit placing h200 at 212.7 µm:
| Section | Nominal (µm) | Keyence (µm) | Std dev (µm) | Ratio |
|---|---|---|---|---|
| 120 µm | 120.0 | 123.0 | 0.17 | 1.025 |
| 150 µm | 150.0 | 155.3 | 0.50 | 1.035 |
| 200 µm | 200.0 | 207.1 | 0.52 | 1.036 |
These three heights are pinned; s, η, and the remaining five heights (30, 40, 50, 70, 90 µm) are free — giving 40 − 7 = 33 DoF.
| Section | h_nom (µm) | h_free7 (µm) | h_key3 (µm) | key3/nom |
|---|---|---|---|---|
| 30um | 30 | 28.47 | 28.89 | 0.9631 |
| 40um | 40 | 38.17 | 38.74 | 0.9685 |
| 50um | 50 | 48.18 | 48.89 | 0.9778 |
| 70um | 70 | 67.07 | 68.06 | 0.9723 |
| 90um | 90 | 86.74 | 88.02 | 0.9780 |
| 120um | 120 | 117.32 | 123.00 ← fixed | 1.0250 |
| 150um | 150 | 151.06 | 155.30 ← fixed | 1.0353 |
| 200um | 200 | 212.74 | 207.10 ← fixed | 1.0355 |
s_key3 = 0.0008561 AU/(mM·µm) (s_key3 / s_emp = 0.9859)
η_key3 = -0.03512
RMS = 0.00757 AU (33 DoF; cf. 0.00685 AU for Stage 7 free, 31 DoF)
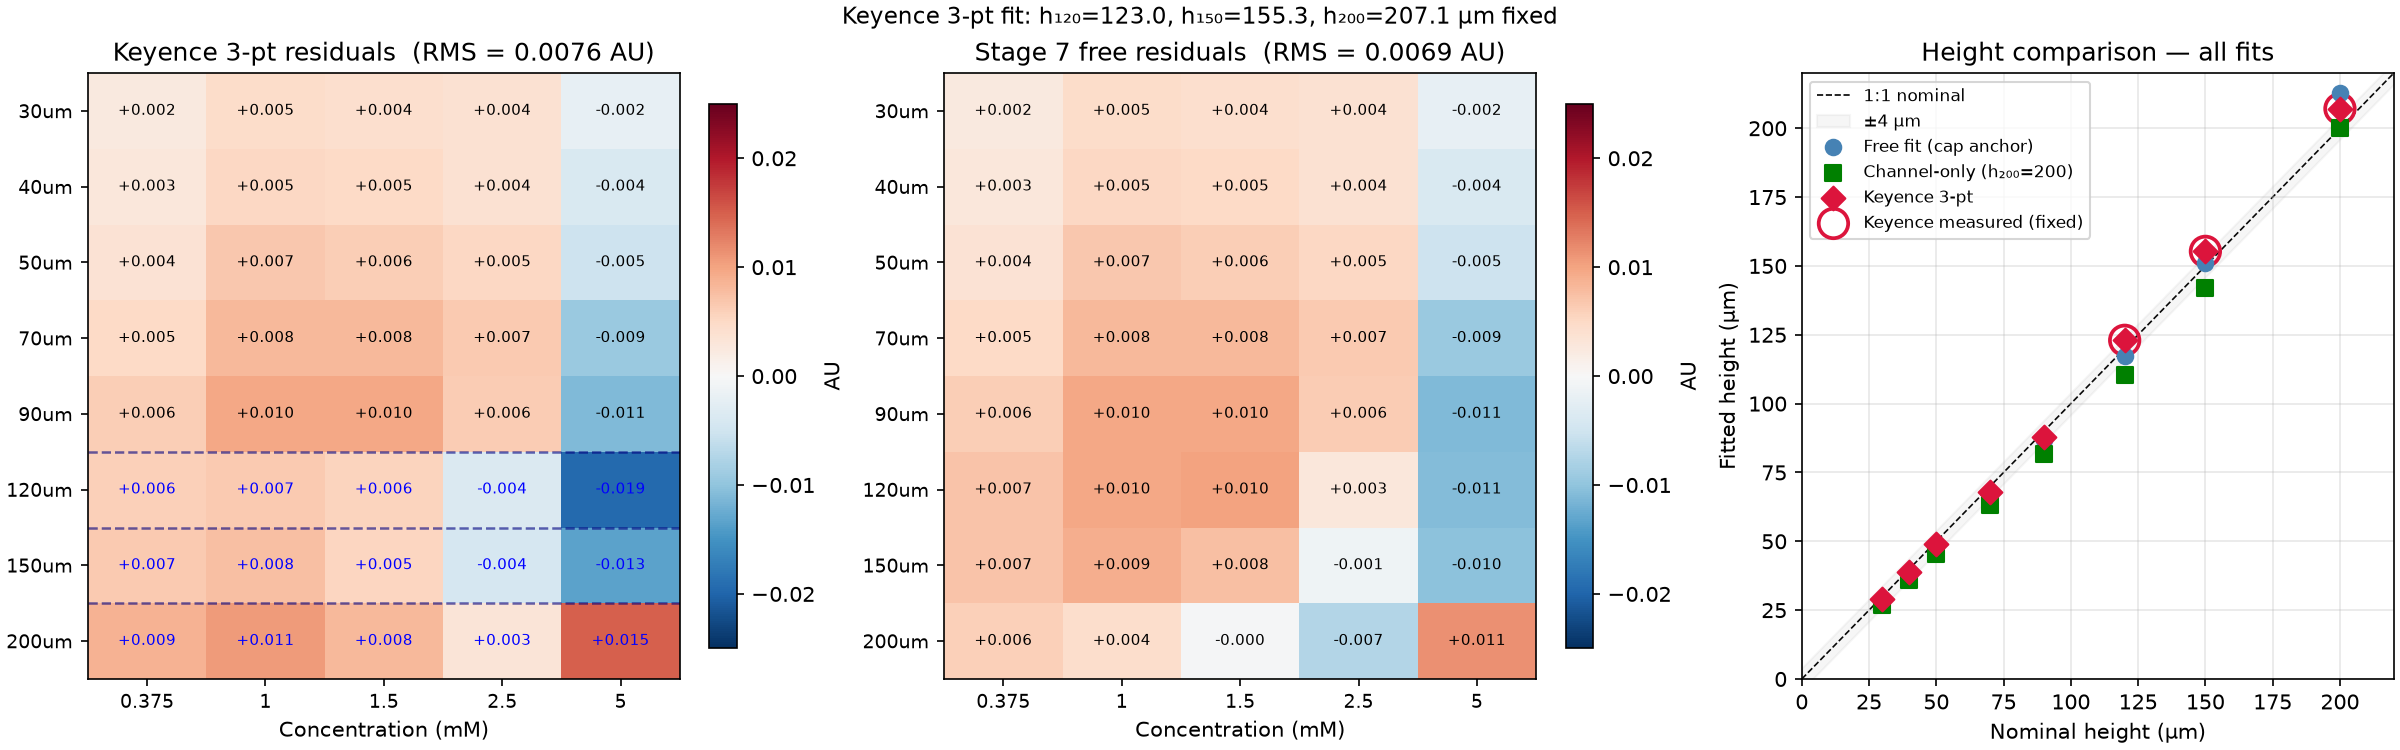
Left: Keyence 3-pt residuals heatmap; blue annotations mark the three fixed rows, dashed lines separate them. Centre: Stage 7 free residuals for comparison. Right: height scatter with all fits overlaid — the three open-circle markers show Keyence-fixed points.
A fourth Keyence measurement of the 70 µm section (67.7 ± 1.44 µm) is now available, providing a critical data point: unlike the 120–200 µm sections, the 70 µm section is below nominal (ratio 0.967).
| Section | Nominal (µm) | Keyence (µm) | Std dev (µm) | Ratio |
|---|---|---|---|---|
| 70 µm | 70.0 | 67.7 | 1.44 | 0.967 |
| 120 µm | 120.0 | 123.0 | 0.17 | 1.025 |
| 150 µm | 150.0 | 155.3 | 0.50 | 1.035 |
| 200 µm | 200.0 | 207.1 | 0.52 | 1.036 |
These four heights are pinned; s, η, and h30, h40, h50, h90 are free — 40 − 6 = 34 DoF.
| Section | h_nom (µm) | h_free7 (µm) | h_key3 (µm) | h_key4 (µm) | key4/nom |
|---|---|---|---|---|---|
| 30um | 30 | 28.47 | 28.89 | 28.87 | 0.9622 |
| 40um | 40 | 38.17 | 38.74 | 38.70 | 0.9676 |
| 50um | 50 | 48.18 | 48.89 | 48.85 | 0.9769 |
| 70um | 70 | 67.07 | 68.06 | 67.70 ← fixed | 0.9671 |
| 90um | 90 | 86.74 | 88.02 | 87.94 | 0.9772 |
| 120um | 120 | 117.32 | 123.00 | 123.00 ← fixed | 1.0250 |
| 150um | 150 | 151.06 | 155.30 | 155.30 ← fixed | 1.0353 |
| 200um | 200 | 212.74 | 207.10 | 207.10 ← fixed | 1.0355 |
s_key4 = 0.0008569 AU/(mM·µm) (s_key4 / s_emp = 0.9868)
η_key4 = -0.03518
RMS = 0.00758 AU (34 DoF)
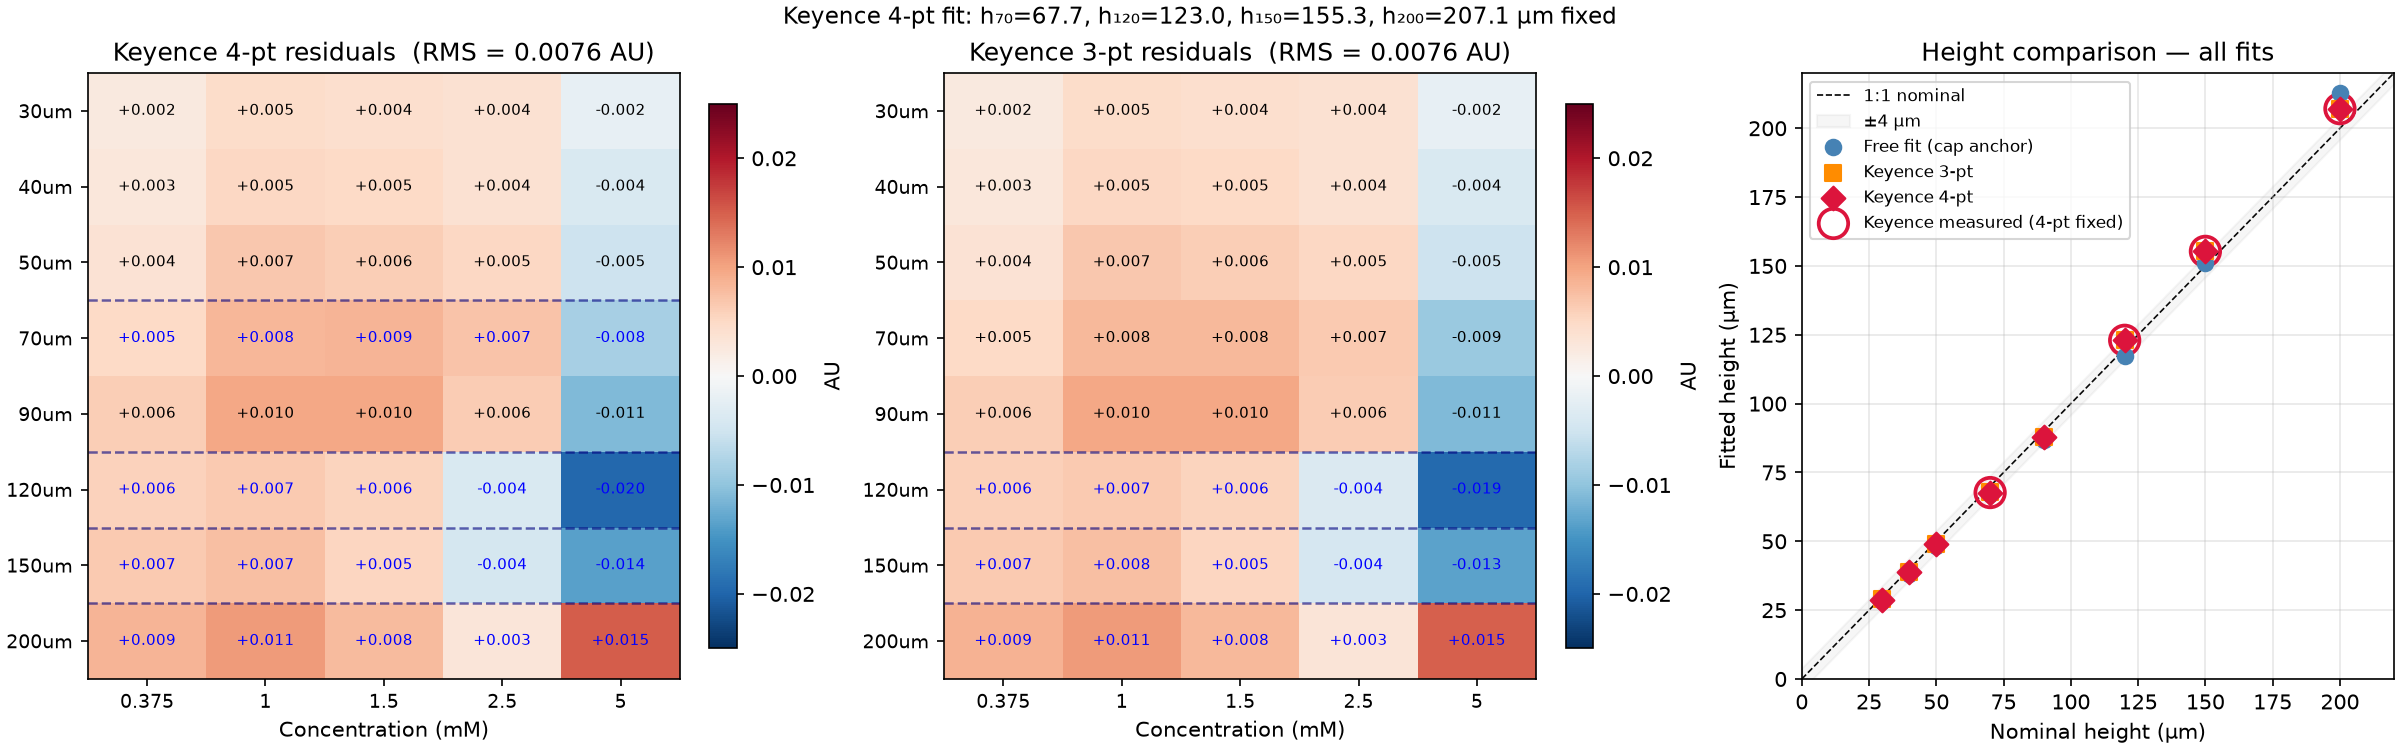
Left: Keyence 4-pt residuals; four fixed rows marked. Centre: Keyence 3-pt residuals for comparison. Right: height comparison across all four fits.
Four independent Keyence measurements reveal a systematic fabrication crossover:
The crossover (where fabricated depth equals nominal) lies between 90 and 120 µm. This depth-dependent sign reversal is consistent with known behaviour in UV-photopolymer layer-by-layer fabrication, where thin features may be undercut and thick features overcut relative to nominal.
| Section | Recommended h (µm) | Source |
|---|---|---|
| 30um | 28.9 | Keyence 4-pt fit |
| 40um | 38.7 | Keyence 4-pt fit |
| 50um | 48.8 | Keyence 4-pt fit |
| 70um | 67.7 | Keyence direct |
| 90um | 87.9 | Keyence 4-pt fit |
| 120um | 123.0 | Keyence direct |
| 150um | 155.3 | Keyence direct |
| 200um | 207.1 | Keyence direct |
| Test | h_200 (µm) | s (AU/(mM·µm)) | RMS (AU) | DoF | Anchor |
|---|---|---|---|---|---|
| Stage 7 free fit | 212.7 | 0.0008683 | 0.00685 | 31 | capillary L = 80 µm |
| 4-conc (no 5 mM) | 224.9 | 0.0008683 | 0.00278 | 23 | capillary L = 80 µm |
| Fix h_200 = 200 µm | 200.0 (fixed) | 0.0008683 | 0.00773 | 32 | capillary + h_200 |
| Channel-only | 200.0 (fixed) | 0.0009215 | 0.00685 | 31 | h_200 = 200 µm only |
| Keyence 3-pt | 207.1 (fixed) | 0.0008561 | 0.00757 | 33 | Keyence h₁₂₀, h₁₅₀, h₂₀₀ |
| Keyence 4-pt | 207.1 (fixed) | 0.0008569 | 0.00758 | 34 | Keyence h₇₀, h₁₂₀, h₁₅₀, h₂₀₀ |
Two self-consistent interpretations exist, differing by 6.1%: