Goal: determine whether Allura Red dye is adsorbing onto channel surfaces (floor, ceiling, walls) by comparing the six light images acquired before and after each dye concentration step.
Surface passivation context: the stepped-height channel was treated with BSA (bovine serum albumin) prior to imaging to passivate the channel surfaces and suppress non-specific dye adsorption. All surfaces are polymerized polyethylene glycol diacrylate (PEGDA), 3D-printed with a custom resin formulation on a custom printer. This stage checks how effective that passivation is.
Physical principle: adsorbed dye remains on surfaces even after
flushing with buffer. A post-dye light image will therefore show reduced intensity
compared to the pre-dye baseline (pre-all). Comparing per-section mean
pixel values across all six light images reveals whether and how fast adsorption
builds up.
Inputs:
2026-08-31_allura_ave_14bit/device_1/light_pre/mean.tif2026-08-31_allura_ave_14bit/device_1/light_post_0.375/mean.tif2026-08-31_allura_ave_14bit/device_1/light_post_1.0/mean.tif2026-08-31_allura_ave_14bit/device_1/light_post_1.5/mean.tif2026-08-31_allura_ave_14bit/device_1/light_post_2.5/mean.tif2026-08-31_allura_ave_14bit/device_1/light_post_5.0/mean.tif2026-08-31_allura_ave_14bit/device_1/dark/mean.tifchannel_rois.json — crop ROI and 8 section ROIsDecision rule:
light_pre for all concentrationsFor each section ROI, the dark-subtracted mean green-channel signal is computed
in every light image, then normalised to light_pre. A ratio of
1.0 means the surface transmits the same light as the pre-dye
baseline; a ratio below 1.0 indicates reduced transmission consistent
with adsorbed dye remaining on the channel surfaces after flushing.
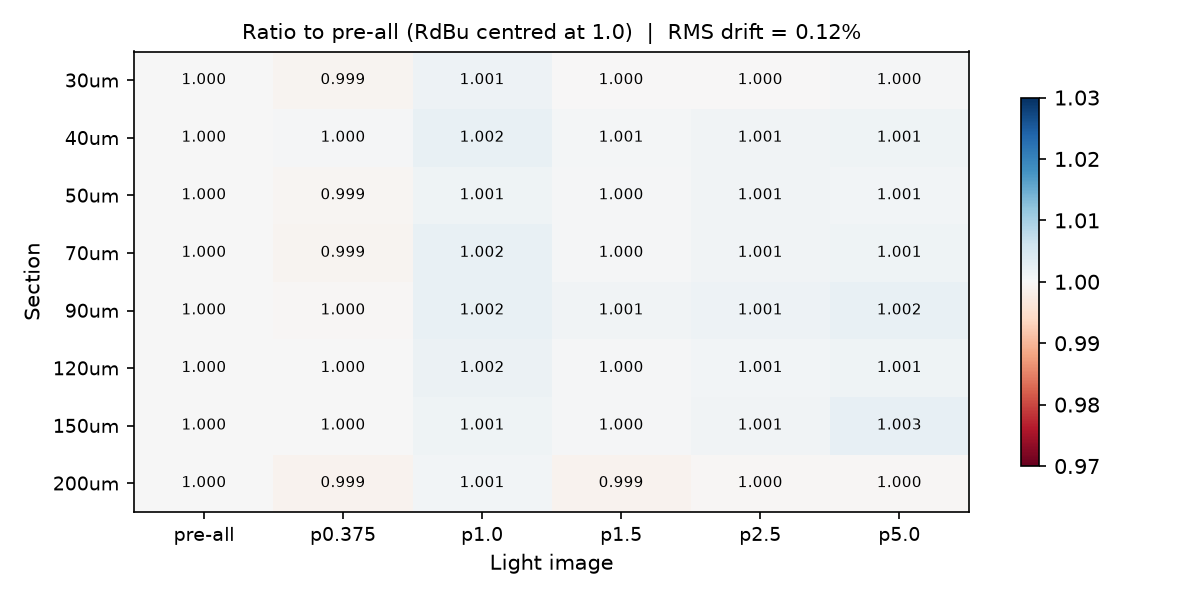
Background colour: white = no change; red = reduced transmission (ratio < 1); blue = increased transmission (ratio > 1). Scale spans ±3 %.
| Section | pre-all | post 0.375 mM | post 1.0 mM | post 1.5 mM | post 2.5 mM | post 5.0 mM |
|---|---|---|---|---|---|---|
| 30um | 1.0000 | 0.9992 | 1.0014 | 0.9998 | 0.9999 | 1.0003 |
| 40um | 1.0000 | 1.0004 | 1.0021 | 1.0007 | 1.0011 | 1.0014 |
| 50um | 1.0000 | 0.9994 | 1.0014 | 1.0004 | 1.0009 | 1.0009 |
| 70um | 1.0000 | 0.9991 | 1.0022 | 1.0003 | 1.0011 | 1.0012 |
| 90um | 1.0000 | 0.9996 | 1.0023 | 1.0011 | 1.0014 | 1.0022 |
| 120um | 1.0000 | 1.0000 | 1.0018 | 1.0004 | 1.0007 | 1.0013 |
| 150um | 1.0000 | 1.0000 | 1.0014 | 1.0004 | 1.0010 | 1.0025 |
| 200um | 1.0000 | 0.9989 | 1.0007 | 0.9990 | 0.9997 | 0.9997 |
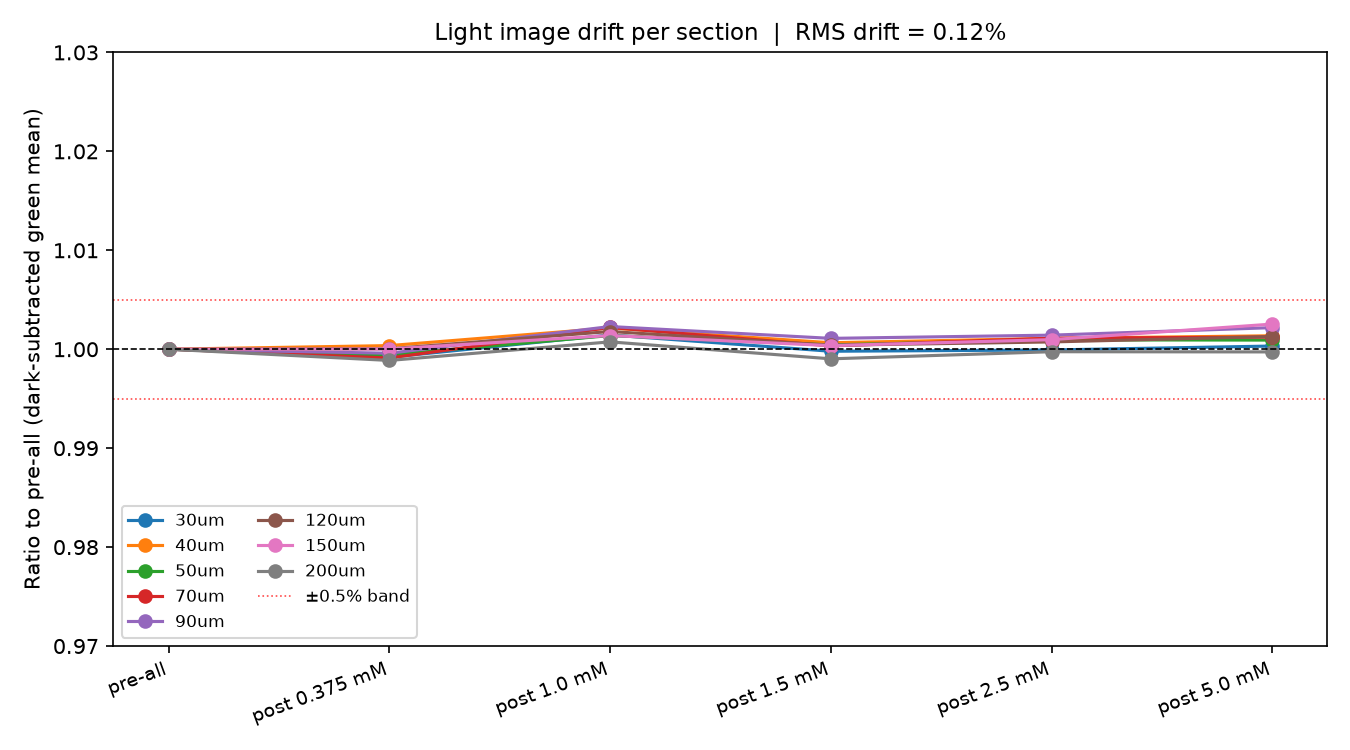
Each line is one section ROI; the x-axis progresses from the pre-dye baseline
(pre-all) through each post-concentration light image. The red dotted
lines mark the ±0.5 % band used as the adsorption threshold. Flat lines near 1.0
indicate successful BSA passivation; downward drift indicates residual adsorbed
dye building up with each successive concentration step.
The same data displayed as a matrix (sections × light steps), with values annotated in each cell. Red = ratio < 1.0 (reduced transmission); blue = ratio > 1.0; white = no change. Colour scale centred at 1.0, spans ±3 %.
light_pre as the single reference for all concentrations in Stages 5–7.