Polychromatic Beer-Lambert Analysis
Allura Red × 510/10 nm Filter — Measured Nanodrop Spectra
Repeats the analysis from filter_update_analysis.py ("Allura Red × 510/10 Filter" section) using directly measured Nanodrop UV-Vis spectra recorded 2026-08-31, replacing the digitised + ε₅₀₈-scaled spectral shape.
1 · Measured Spectra Overview
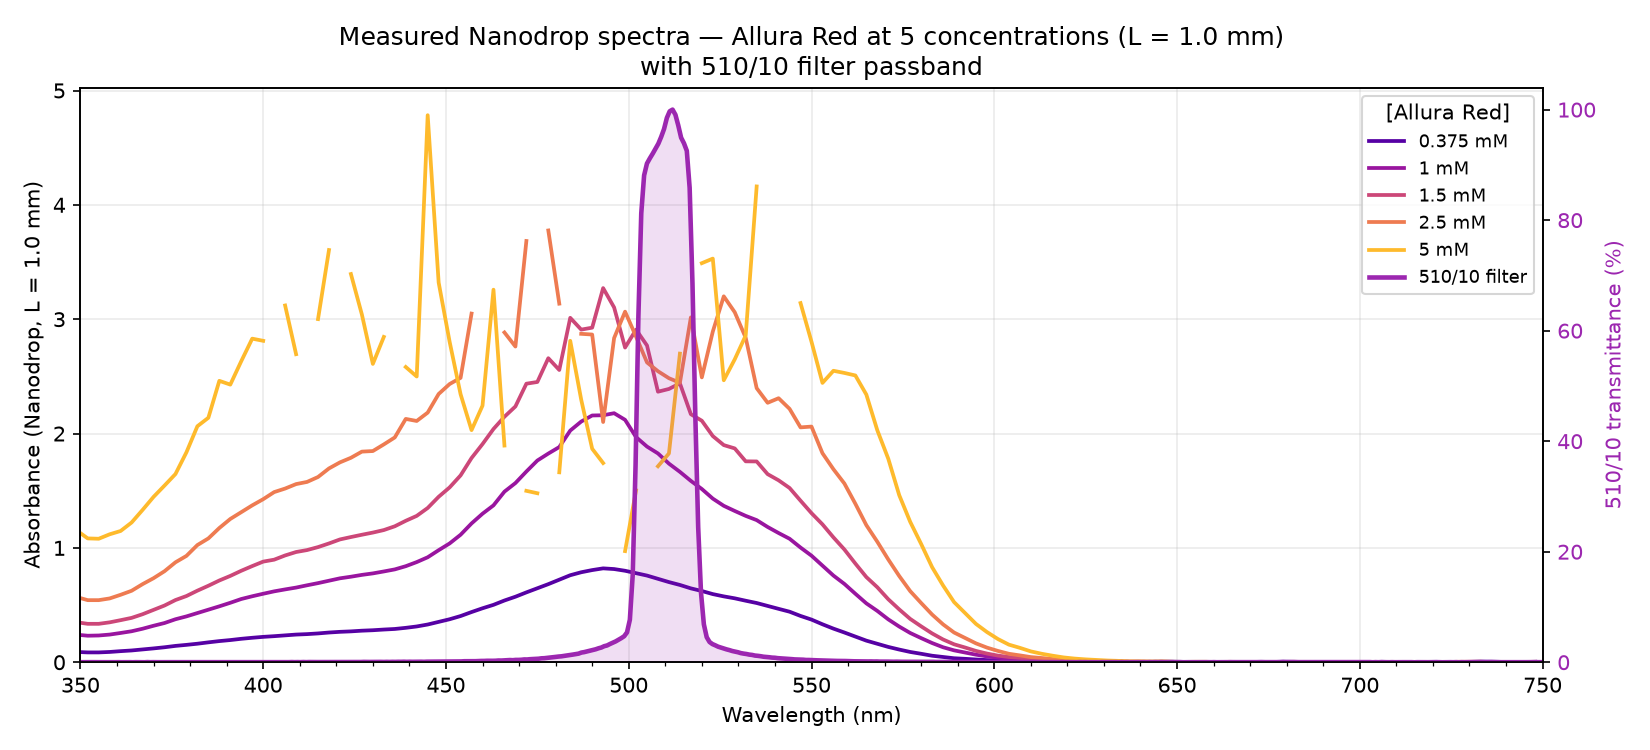
Five Allura Red concentrations (0.375, 1.0, 1.5, 2.5, and 5 mM) were measured in the Nanodrop against a 10 mM HEPES blank at a 1.0 mm path length. The measured visible absorption peak is 493–496 nm, slightly blue-shifted from the ~506 nm value in the digitised spectrum used previously. The 510/10 filter passband (480.8–536.9 nm) overlaps this peak well.
2 · Reference Spectrum Selection
The polychromatic calculation requires A(λ) to be in the Beer-Lambert linear
regime. At L = 1.0 mm the expected peak absorbance is approximately:
| Concentration | Expected A₅₀₈ (L=1.0 mm) | Status |
|---|---|---|
| 0.375 mM | ~0.97 | ✓ linear |
| 1.0 mM | ~2.59 | ⚠ moderate saturation |
| 1.5 mM | ~3.88 | ✗ saturated |
| 2.5 mM | ~6.47 | ✗ severely saturated |
| 5.0 mM | ~12.9 | ✗ off-scale |
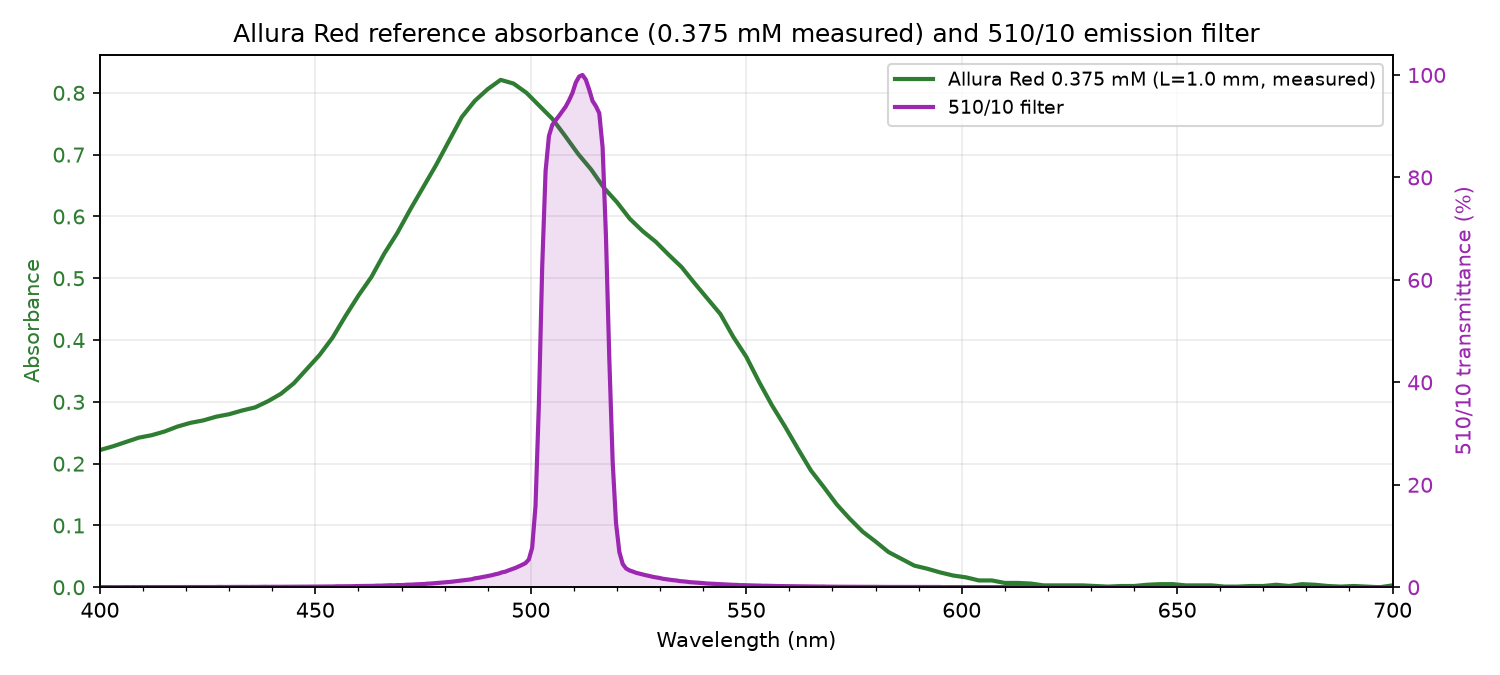
The 0.375 mM spectrum is used as the reference. It has the lowest saturation risk in the 480–540 nm passband while still providing good signal. All higher concentrations are used only for the Beer-Lambert linearity check below.
3 · Beer-Lambert Linearity Check
The filter-weighted polychromatic absorbance A_poly is computed for each measured
concentration and compared against the ideal linear prediction anchored at 0.375 mM:
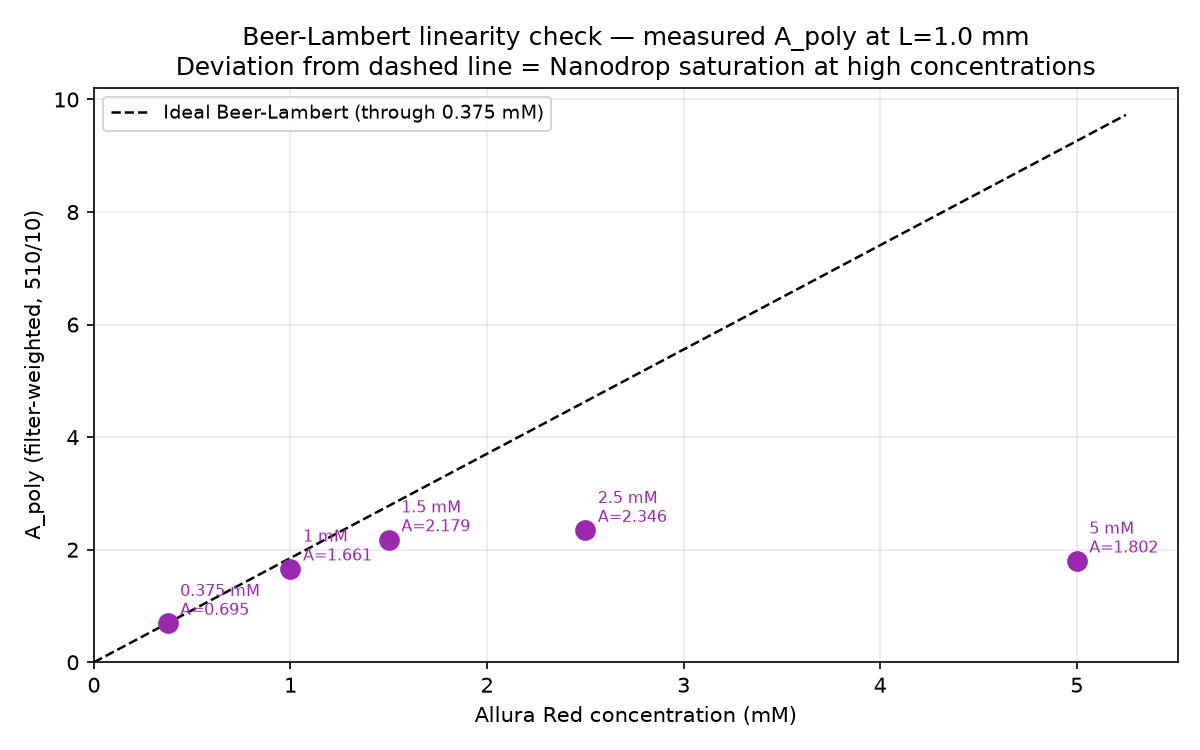
A_poly for each measured concentration at L = 1.0 mm,
versus the ideal Beer-Lambert line anchored to 0.375 mM (dashed). Strong negative deviations at
1.0 mM and above confirm Nanodrop saturation; only the 0.375 mM point is usable as a spectral
reference.
| Concentration (mM) | A_poly (measured) | Measured ratio / 0.375 mM | Expected ratio | Deviation (%) |
|---|---|---|---|---|
| 0.375 | 0.6947 | 1.0000 | 1.0000 | 0.00 % |
| 1.0 | 1.6614 | 2.3914 | 2.6667 | −10.32 % |
| 1.5 | 2.1795 | 3.1371 | 4.0000 | −21.57 % |
| 2.5 | 2.3458 | 3.3764 | 6.6667 | −49.35 % |
| 5.0 | 1.8024 | 2.5944 | 13.3333 | −80.54 % |
4 · Polychromatic Beer-Lambert Analysis
Using the 0.375 mM reference spectrum, the absorbance at any working condition
(C, L) is scaled as:
A(λ; C, L) = A_ref(λ) × (C / 0.375 mM) × (L / 1000 µm)
The filter-weighted polychromatic transmittance and apparent absorbance are then:
T_poly = ∫ F(λ) · 10−A(λ) dλ / ∫ F(λ) dλ → A_meas = −log₁₀(T_poly)
4.1 · Polychromatic transmittance at the reference condition
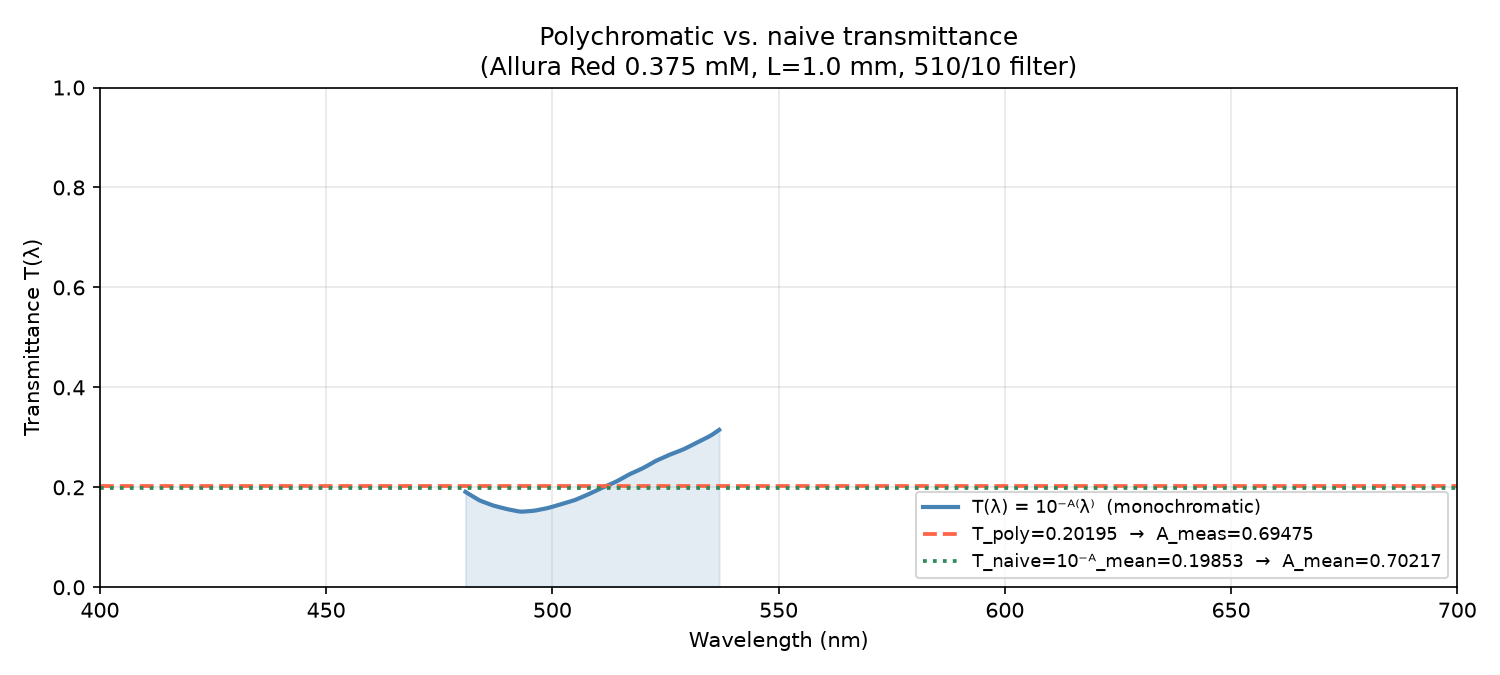
Filter-weighted mean A = 0.7022
T_poly (integrated) = 0.20196 → A_meas = 0.69475
T_naive (10−Ā) = 0.19853 → A_mean = 0.70217
Polychromatic underestimate: 1.057 % — negligible for this dye–filter pair.
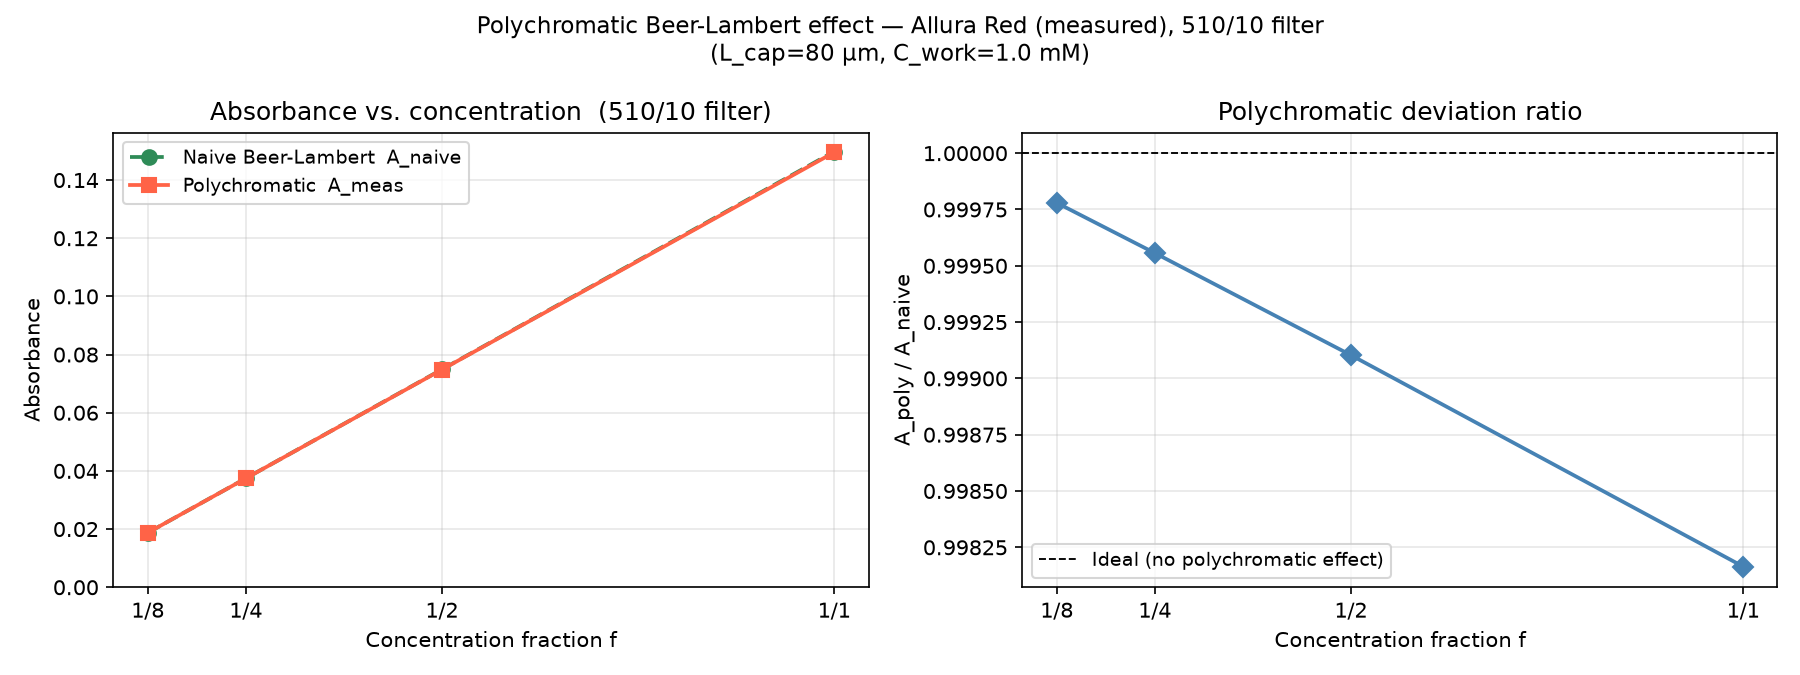
4.2 · Absorbance vs. concentration fraction and deviation ratio
Scaling to a working concentration of 1.0 mM in the channels and a capillary calibration path length of 80 µm, the polychromatic absorbance is computed at four concentration fractions of the 1.0 mM stock:
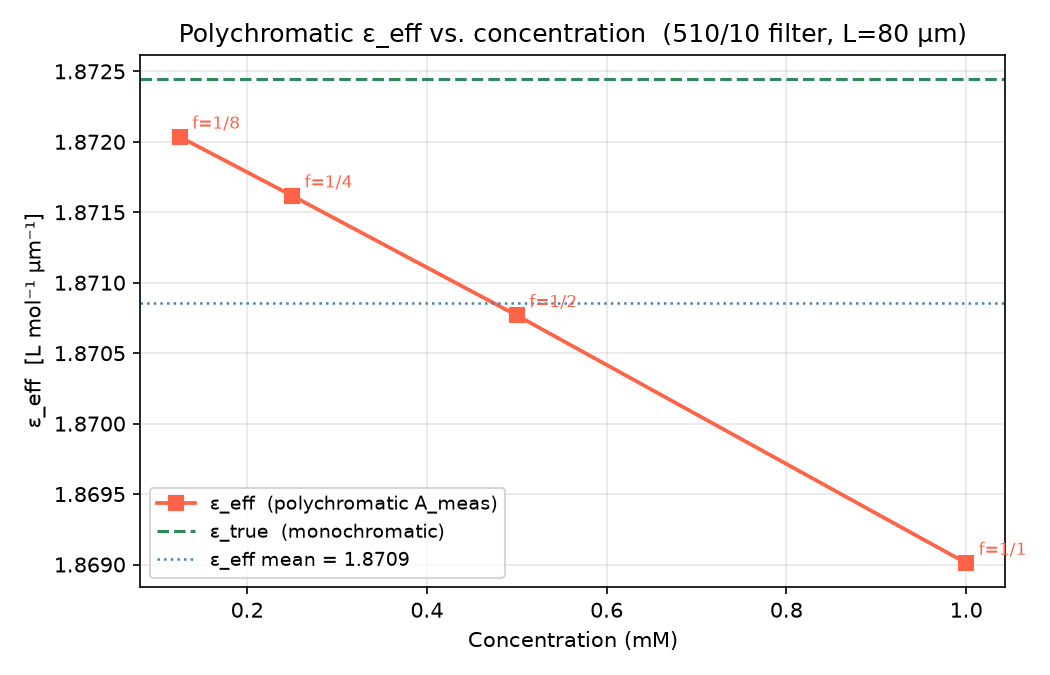
4.3 · Effective molar absorptivity
5 · Polychromatic A_meas Table
Computed A_meas for all eight channel heights (30–200 µm) at four concentration fractions of the 1.0 mM working stock. Reference calibration: 0.375 mM Nanodrop spectrum at L = 1.0 mm, scaled to (C, L) via Beer-Lambert.
| Height (µm) | f = 1/8 (0.125 mM) | f = 1/4 (0.250 mM) | f = 1/2 (0.500 mM) | f = 1/1 (1.000 mM) |
|---|---|---|---|---|
| 30 | 0.0070 | 0.0140 | 0.0281 | 0.0561 |
| 40 | 0.0094 | 0.0187 | 0.0374 | 0.0748 |
| 50 | 0.0117 | 0.0234 | 0.0468 | 0.0935 |
| 70 | 0.0164 | 0.0328 | 0.0655 | 0.1309 |
| 90 | 0.0211 | 0.0421 | 0.0842 | 0.1682 |
| 120 | 0.0281 | 0.0561 | 0.1122 | 0.2241 |
| 150 | 0.0351 | 0.0702 | 0.1402 | 0.2799 |
| 200 | 0.0468 | 0.0935 | 0.1868 | 0.3726 |
All values in absorbance units (AU). Working concentration in channels: 1.0 mM. Capillary calibration path length: 80 µm.
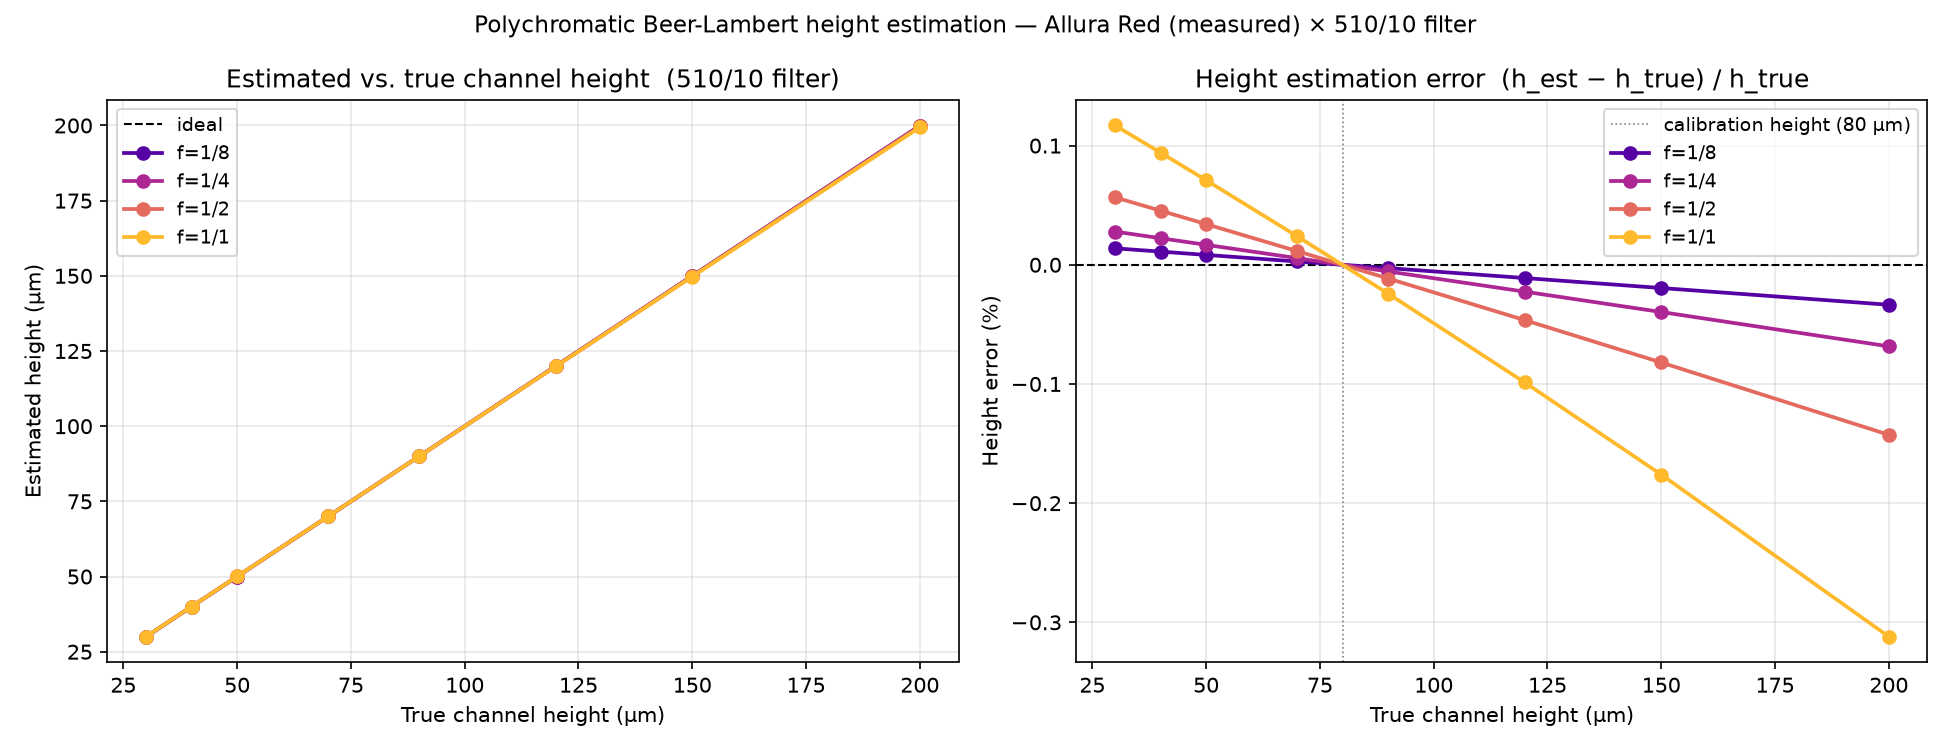
6 · Height Estimation Accuracy
Heights are estimated from measured A_meas using the capillary calibration at 80 µm:
h_est = 80 µm × A_meas(h) / A_meas(80 µm).
The error (h_est − h_true) / h_true quantifies the residual polychromatic bias.
7 · Notes on Nanodrop Measurement Quality
- Peak wavelength: The measured visible absorption peak is at 493–496 nm, slightly blue-shifted from the ~506 nm value in the digitised reference spectrum. This difference may reflect solvent composition, pH, or digitisation uncertainty in the literature source.
- Saturation at L = 1.0 mm: Only the 0.375 mM spectrum is in the linear Beer-Lambert regime. For future Nanodrop measurements, use ≤ 0.4 mM or the shorter 0.1 mm Nanodrop path if available.
- NaN values: The 2.5 mM and 5 mM spectra have NaN readings (5 % and 20 % respectively) in the 480–540 nm passband due to detector saturation. These spectra are not used for the polychromatic calculation.
- Effective ε: ε_eff = 1.871 L mol⁻¹ µm⁻¹ from the measured spectrum versus 2.59 × 10⁴ L mol⁻¹ cm⁻¹ = 2.59 L mol⁻¹ µm⁻¹ from the literature value used previously. The 28 % difference likely reflects the digitisation error in the literature spectrum shape and/or concentration uncertainty in the 0.375 mM Nanodrop sample. The capillary calibration strategy eliminates this uncertainty from the height inference.