Urea Calibration (546-10 filter) — 2026-10-24, 3 mM HEPES
Dataset:2026-10-24_full_run_16bit/urea_samples/ — one BSA-passivated
stepped-height channel (10 sections, 330 → 30 um nominal), urea + urease pre-mixed
off-chip, imaged through the 546-10 bandpass filter in the randomized order from
Urea Assay Prep - Printable.pdf (5 frames per sample). ROIs come from
channel_rois.json (see channel_roi.py).
What changed vs. 2026-10-02: the working solution is 3 mM HEPES + 0.08 % phenol
red (was 10 mM). With less buffer, the same amount of ammonia from urea hydrolysis
should move the pH, and so the phenol red absorbance, further. 0mM was imaged
first this time, right after the light/dark frames.
Scope: urea data only. The Allura Red frames are not used here, so no relative
channel heights enter the analysis. The sigmoid shape parameters (c50, h) do not
depend on path length, so each section is fit on its own.
Pipeline
- Average the 5 frames per condition;
T = (I - dark) / (light - dark)with the averaged 546-10 light/dark frames. - Background (illumination) correction for every frame:
b= medianTin the clear substrate strips above and below the channel (first/last 40 crop rows);A = -log10(<T>_ROI / b). - QA — blanks, replicate scatter vs. frame noise, path-length linearity.
- Per-section 4-parameter sigmoid fits
a(c) = a_min + (a_max - a_min) / (1 + (c / c50)^-h). - Residuals vs. time (time since mixing = imaging time + a constant).
- How well is
hconstrained? Profile overh, fixed-a_maxfits, and a joint fit over the thinner sections. - Comparison with the 10/02 run (10 mM HEPES, same filter) and earlier runs.
process.txt records 9.5 mg urea weighed for the top stock (prep sheet:
9.0 mg; confirmed for this run), so the top stock is ≈31.7 mM, not 30 mM, and every sample
is ×1.056 its label. The toggle below switches between corrected and label concentrations.
Concentrations refer to the urea sample before 1:1 mixing with urease.
☑ Use mass-corrected urea concentrations (x 1.0556: 9.5 mg weighed vs 9.0 mg nominal)
↑ topStep 1 — Background (illumination) correction
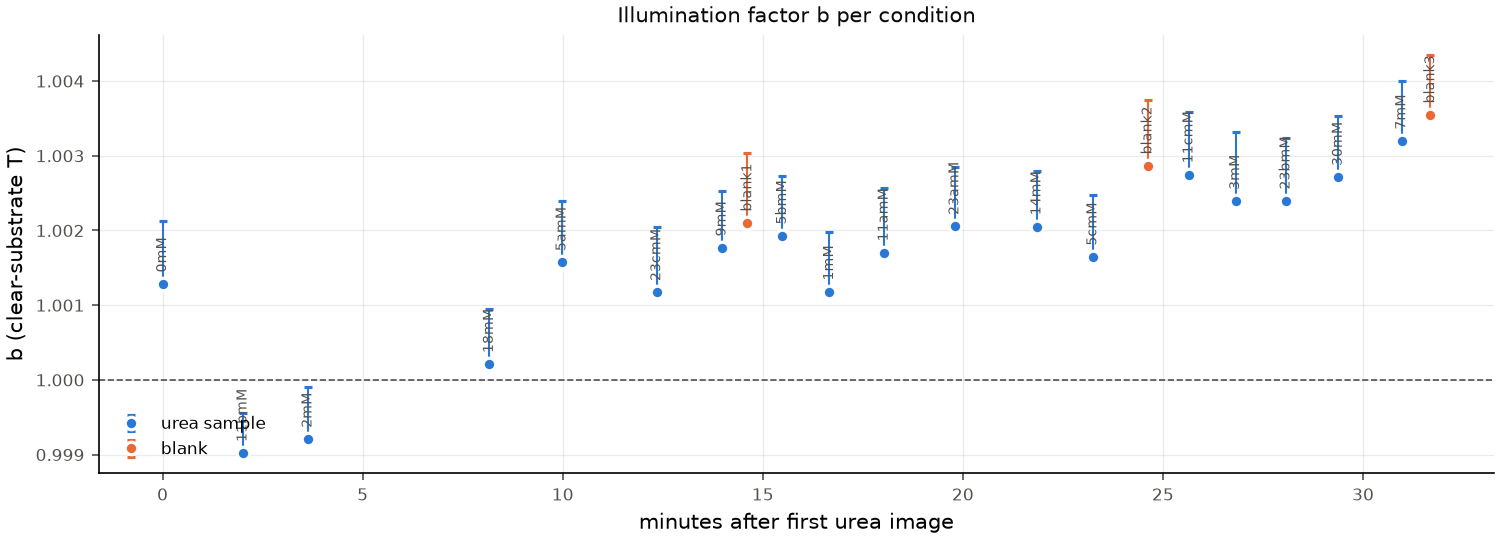
b is the median transmittance of the clear substrate above and below the channel. It
should be 1 when the illumination matches the light frame. Error bars span the 5
individual frames of each burst. 0mM was imaged first, ≈1 min after the light frame.
| condition | time | b | b range in burst | dA_bg = -log10 b |
|---|---|---|---|---|
| 0mM | 14:33:24 | 1.0013 | 0.00047 | -0.0006 |
| 11bmM | 14:35:24 | 0.999 | 0.00023 | 0.0004 |
| 2mM | 14:37:02 | 0.9992 | 0.00026 | 0.0003 |
| 18mM | 14:41:34 | 1.0002 | 0.00037 | -0.0001 |
| 5amM | 14:43:23 | 1.0016 | 0.00013 | -0.0007 |
| 23cmM | 14:45:45 | 1.0012 | 0.00028 | -0.0005 |
| 9mM | 14:47:23 | 1.0018 | 5e-05 | -0.0008 |
| blank1 | 14:48:01 | 1.0021 | 0.00021 | -0.0009 |
| 5bmM | 14:48:53 | 1.0019 | 0.00017 | -0.0008 |
| 1mM | 14:50:04 | 1.0012 | 0.00016 | -0.0005 |
| 11amM | 14:51:26 | 1.0017 | 0.00028 | -0.0007 |
| 23amM | 14:53:12 | 1.0021 | 0.00012 | -0.0009 |
| 14mM | 14:55:15 | 1.0021 | 0.00016 | -0.0009 |
| 5cmM | 14:56:39 | 1.0016 | 0.00016 | -0.0007 |
| blank2 | 14:58:01 | 1.0029 | 0.00011 | -0.0012 |
| 11cmM | 14:59:03 | 1.0027 | 0.00016 | -0.0012 |
| 3mM | 15:00:13 | 1.0024 | 0.00031 | -0.001 |
| 23bmM | 15:01:28 | 1.0024 | 0.00023 | -0.001 |
| 30mM | 15:02:47 | 1.0027 | 0.00017 | -0.0012 |
| 7mM | 15:04:22 | 1.0032 | 8e-05 | -0.0014 |
| blank3 | 15:05:05 | 1.0035 | 9e-05 | -0.0015 |
↑ topStep 2 — Section absorbance
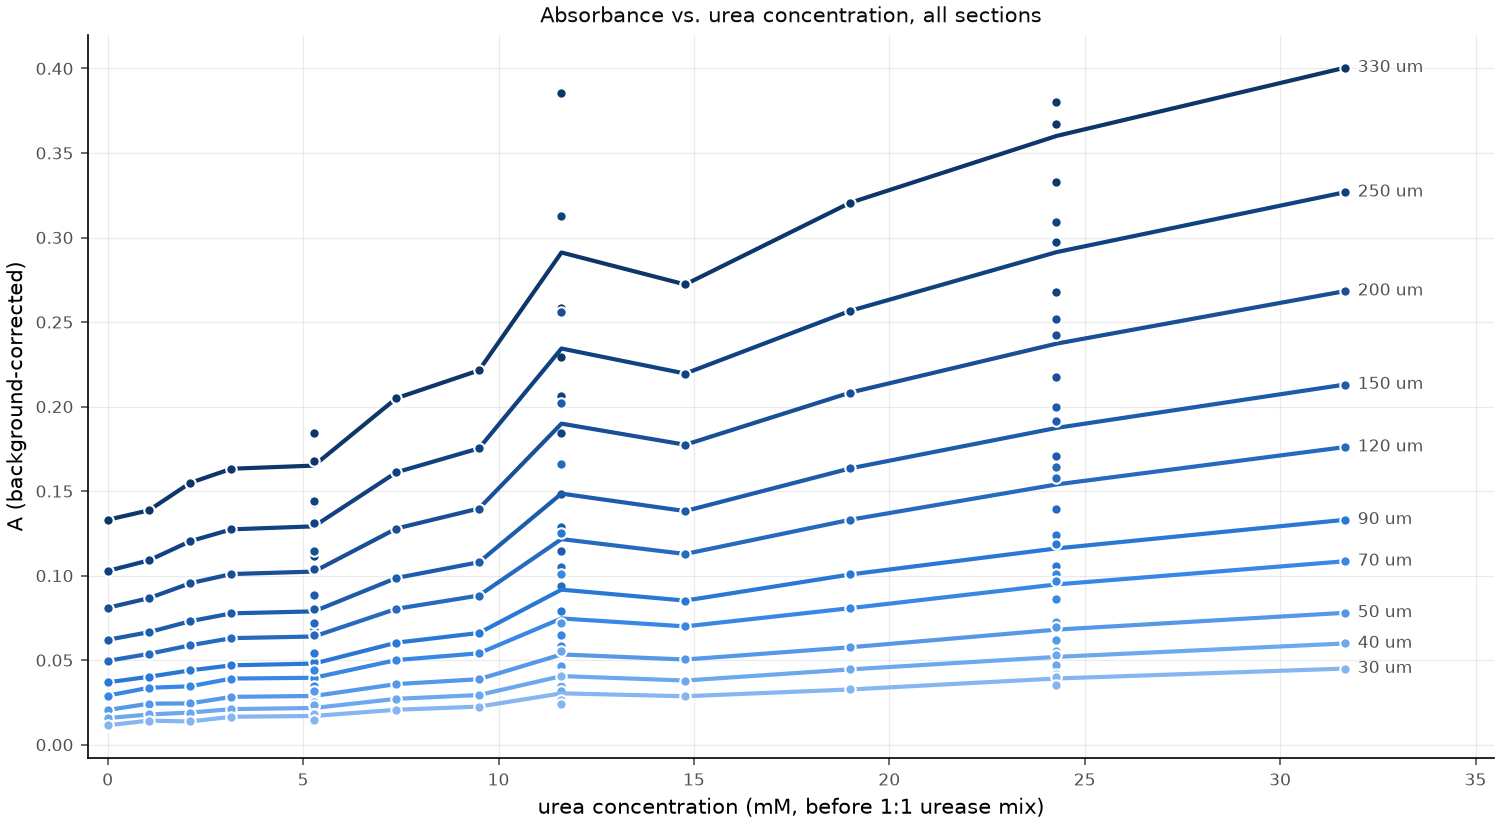
A = -log10(<T>_ROI / b) from the 5-frame average, in acquisition order. Concentrations
in the plot follow the toggle above. Lines connect replicate means.
| condition | time | c (mM) | 330 um | 250 um | 200 um | 150 um | 120 um | 90 um | 70 um | 50 um | 40 um | 30 um |
|---|---|---|---|---|---|---|---|---|---|---|---|---|
| 0mM | 14:33:24 | 0 | 0.133 | 0.1028 | 0.081 | 0.062 | 0.0496 | 0.0369 | 0.029 | 0.0205 | 0.0157 | 0.0115 |
| 11bmM | 14:35:24 | 11.611 | 0.3854 | 0.3125 | 0.2558 | 0.2021 | 0.1658 | 0.1253 | 0.1009 | 0.0718 | 0.0555 | 0.0406 |
| 2mM | 14:37:02 | 2.111 | 0.1549 | 0.1204 | 0.0955 | 0.073 | 0.0588 | 0.044 | 0.0345 | 0.0244 | 0.019 | 0.0137 |
| 18mM | 14:41:34 | 19 | 0.3206 | 0.2566 | 0.2083 | 0.1634 | 0.1331 | 0.1007 | 0.0808 | 0.0576 | 0.0445 | 0.0327 |
| 5amM | 14:43:23 | 5.278 | 0.1678 | 0.1313 | 0.104 | 0.08 | 0.0651 | 0.0489 | 0.0397 | 0.0294 | 0.0231 | 0.018 |
| 23cmM | 14:45:45 | 24.278 | 0.3799 | 0.3089 | 0.2521 | 0.1997 | 0.1643 | 0.1242 | 0.1012 | 0.0727 | 0.0557 | 0.042 |
| 9mM | 14:47:23 | 9.5 | 0.2214 | 0.1753 | 0.1397 | 0.1079 | 0.0882 | 0.0661 | 0.0541 | 0.0387 | 0.0294 | 0.0225 |
| blank1 | 14:48:01 | 0.0013 | 0.0007 | 0.0007 | 0.0008 | 0.0006 | 0.0006 | 0.0022 | 0.0022 | 0.001 | 0.0021 | |
| 5bmM | 14:48:53 | 5.278 | 0.1843 | 0.1443 | 0.1145 | 0.0884 | 0.0718 | 0.0539 | 0.0444 | 0.0318 | 0.0237 | 0.0184 |
| 1mM | 14:50:04 | 1.056 | 0.1386 | 0.109 | 0.0867 | 0.0666 | 0.0537 | 0.0402 | 0.0337 | 0.0243 | 0.0179 | 0.0142 |
| 11amM | 14:51:26 | 11.611 | 0.2585 | 0.2061 | 0.1659 | 0.1286 | 0.105 | 0.0792 | 0.0648 | 0.0464 | 0.0346 | 0.0266 |
| 23amM | 14:53:12 | 24.278 | 0.3673 | 0.2975 | 0.2424 | 0.1916 | 0.1578 | 0.1186 | 0.0969 | 0.0694 | 0.0529 | 0.0399 |
| 14mM | 14:55:15 | 14.778 | 0.2722 | 0.2195 | 0.1774 | 0.1382 | 0.1128 | 0.0852 | 0.07 | 0.0504 | 0.038 | 0.0287 |
| 5cmM | 14:56:39 | 5.278 | 0.1432 | 0.1119 | 0.0887 | 0.0682 | 0.0551 | 0.041 | 0.0346 | 0.0253 | 0.0184 | 0.0146 |
| blank2 | 14:58:01 | 0.0008 | 0.0004 | 0.0005 | 0.0006 | 0.0009 | 0.0004 | 0.0026 | 0.0025 | 0.0011 | 0.0021 | |
| 11cmM | 14:59:03 | 11.611 | 0.2296 | 0.1845 | 0.1481 | 0.1148 | 0.0941 | 0.0706 | 0.0584 | 0.0419 | 0.0317 | 0.024 |
| 3mM | 15:00:13 | 3.167 | 0.1632 | 0.1274 | 0.1009 | 0.0777 | 0.063 | 0.0469 | 0.0391 | 0.0283 | 0.021 | 0.0165 |
| 23bmM | 15:01:28 | 24.278 | 0.333 | 0.2677 | 0.2172 | 0.1707 | 0.1397 | 0.1055 | 0.0863 | 0.0621 | 0.0472 | 0.0355 |
| 30mM | 15:02:47 | 31.667 | 0.4005 | 0.3268 | 0.2683 | 0.213 | 0.1761 | 0.133 | 0.1085 | 0.078 | 0.0599 | 0.045 |
| 7mM | 15:04:22 | 7.389 | 0.205 | 0.1611 | 0.1279 | 0.0986 | 0.0804 | 0.0604 | 0.0501 | 0.0359 | 0.0271 | 0.0207 |
| blank3 | 15:05:05 | 0.0006 | 0.0004 | 0.0002 | 0.0006 | 0.0007 | 0.0005 | 0.0026 | 0.0024 | 0.0015 | 0.0021 |
↑ topStep 3 — QA
- Blanks should read A ≈ 0 in every section (the light frame was taken with blank buffer).
- Replicate scatter vs. frame noise: the SD of the independently prepared a/b/c samples (5, 11, 23 mM) compared with the SD of A across the 5 frames of one burst. A large ratio means preparation (or timing) variation dominates, not camera noise.
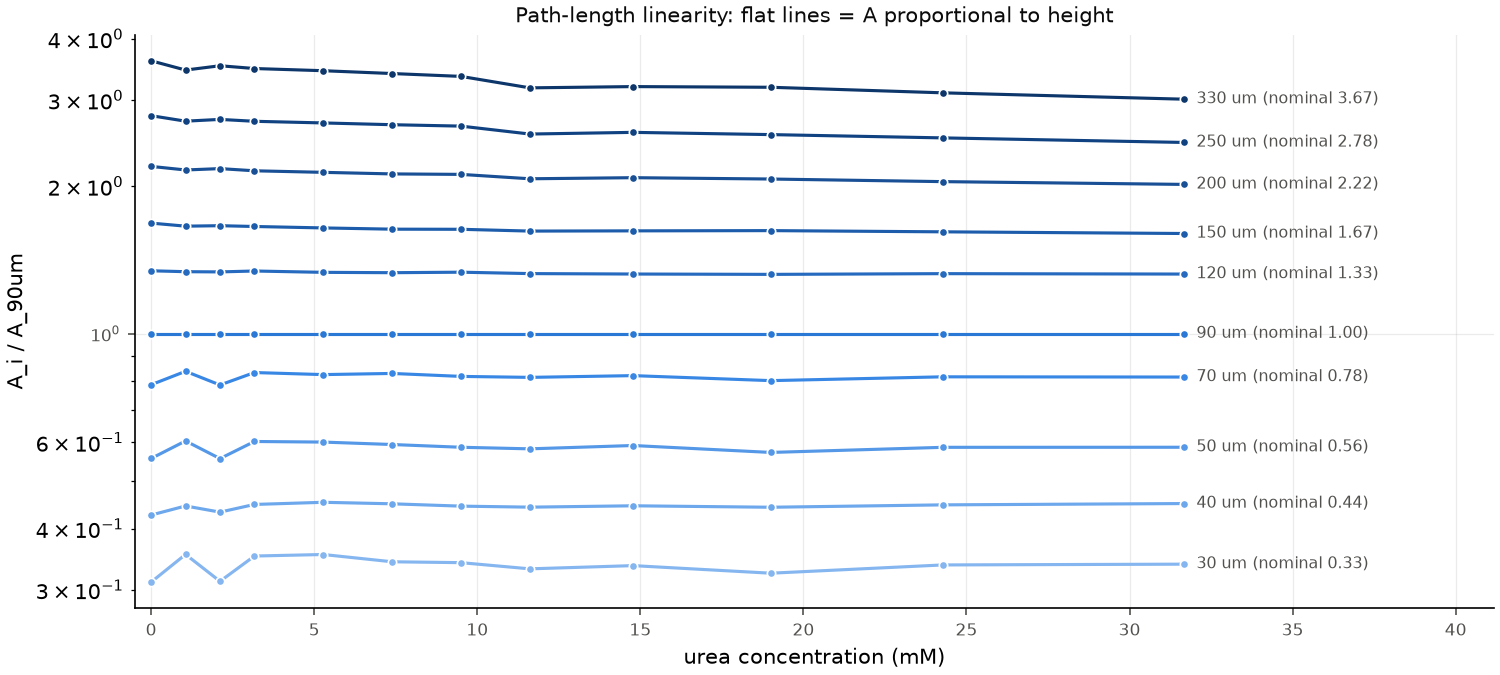
- Path-length linearity: if A were exactly proportional to channel height,
A_i / A_90umwould be flat in concentration for each section.
Blanks
| blank | time | 330 um | 250 um | 200 um | 150 um | 120 um | 90 um | 70 um | 50 um | 40 um | 30 um |
|---|---|---|---|---|---|---|---|---|---|---|---|
| blank1 | 14:48:01 | 0.0013 | 0.0007 | 0.0007 | 0.0008 | 0.0006 | 0.0006 | 0.0022 | 0.0022 | 0.001 | 0.0021 |
| blank2 | 14:58:01 | 0.0008 | 0.0004 | 0.0005 | 0.0006 | 0.0009 | 0.0004 | 0.0026 | 0.0025 | 0.0011 | 0.0021 |
| blank3 | 15:05:05 | 0.0006 | 0.0004 | 0.0002 | 0.0006 | 0.0007 | 0.0005 | 0.0026 | 0.0024 | 0.0015 | 0.0021 |
Replicate scatter vs. 5-frame noise
| label (mM) | quantity | 330 um | 250 um | 200 um | 150 um | 120 um | 90 um | 70 um | 50 um | 40 um | 30 um |
|---|---|---|---|---|---|---|---|---|---|---|---|
| 5 | replicate SD | 0.0207 | 0.0163 | 0.013 | 0.0101 | 0.0084 | 0.0065 | 0.0049 | 0.0033 | 0.0029 | 0.0021 |
| 5 | frame SD (median) | 0.0003 | 0.0003 | 0.0004 | 0.0002 | 0.0003 | 0.0003 | 0.0003 | 0.0003 | 0.0003 | 0.0002 |
| 5 | ratio | 65 | 51.7 | 36 | 40.8 | 27.5 | 25.2 | 16.7 | 10.8 | 11.1 | 12.1 |
| 5 | replicate CV % | 12.5 | 12.6 | 12.7 | 12.8 | 13.1 | 13.6 | 12.4 | 11.4 | 13.4 | 12.3 |
| 11 | replicate SD | 0.0829 | 0.0685 | 0.0577 | 0.0469 | 0.0386 | 0.0294 | 0.0229 | 0.0161 | 0.013 | 0.0089 |
| 11 | frame SD (median) | 0.0002 | 0.0002 | 0.0003 | 0.0002 | 0.0004 | 0.0002 | 0.0003 | 0.0004 | 0.0002 | 0.0001 |
| 11 | ratio | 477.9 | 282 | 171.5 | 232.1 | 107.4 | 132.8 | 88.7 | 45.3 | 56.1 | 164.3 |
| 11 | replicate CV % | 28.5 | 29.2 | 30.4 | 31.6 | 31.8 | 32.1 | 30.7 | 30.2 | 32.1 | 29.4 |
| 23 | replicate SD | 0.0243 | 0.0213 | 0.018 | 0.015 | 0.0128 | 0.0096 | 0.0077 | 0.0054 | 0.0043 | 0.0033 |
| 23 | frame SD (median) | 0.0002 | 0.0003 | 0.0003 | 0.0003 | 0.0003 | 0.0003 | 0.0003 | 0.0004 | 0.0003 | 0.0001 |
| 23 | ratio | 102.6 | 64.8 | 69.3 | 51.9 | 40.5 | 31.4 | 24.6 | 14 | 13.4 | 24.1 |
| 23 | replicate CV % | 6.8 | 7.3 | 7.6 | 8 | 8.3 | 8.3 | 8.1 | 8 | 8.3 | 8.5 |
Path-length linearity
↑ topStep 4 — Per-section sigmoid fits
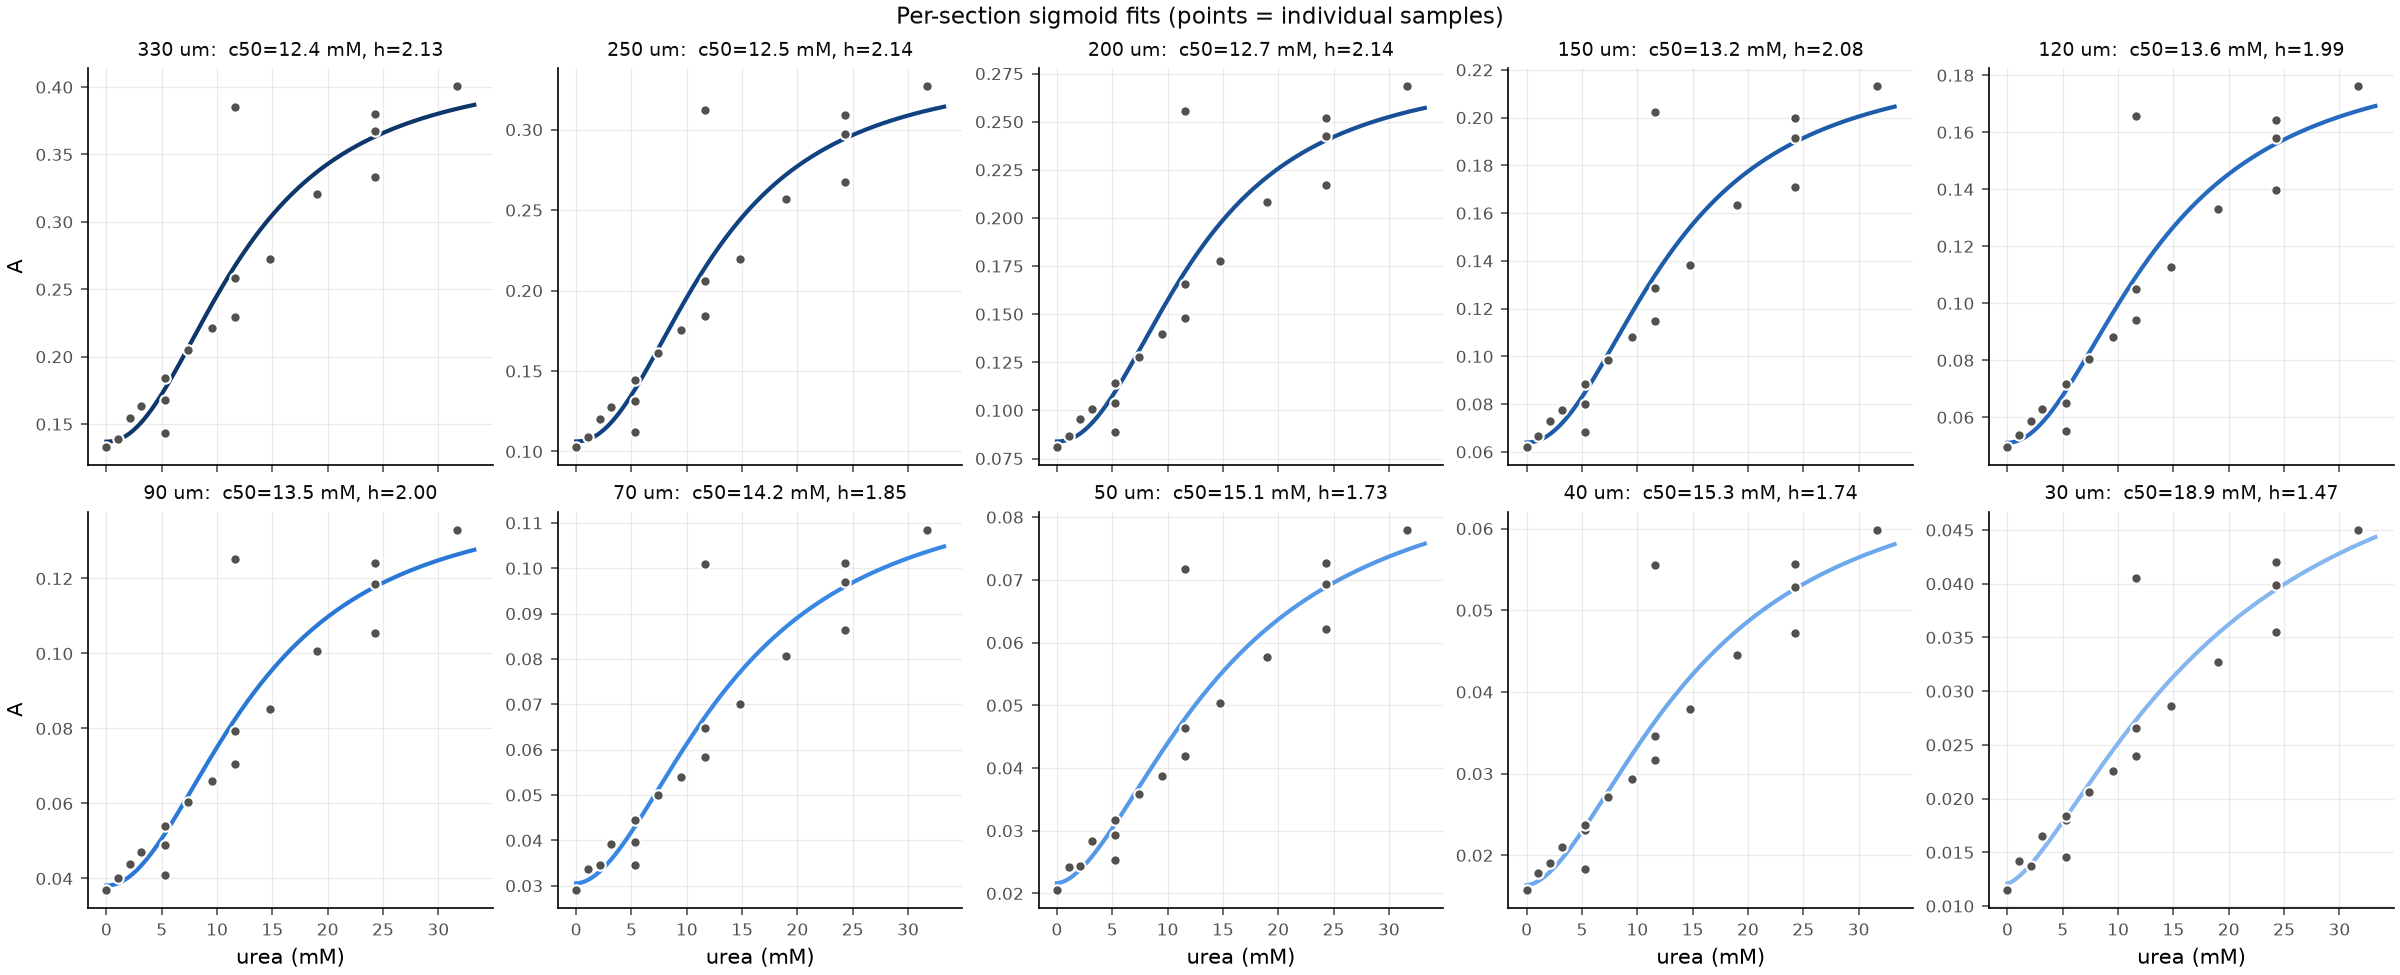
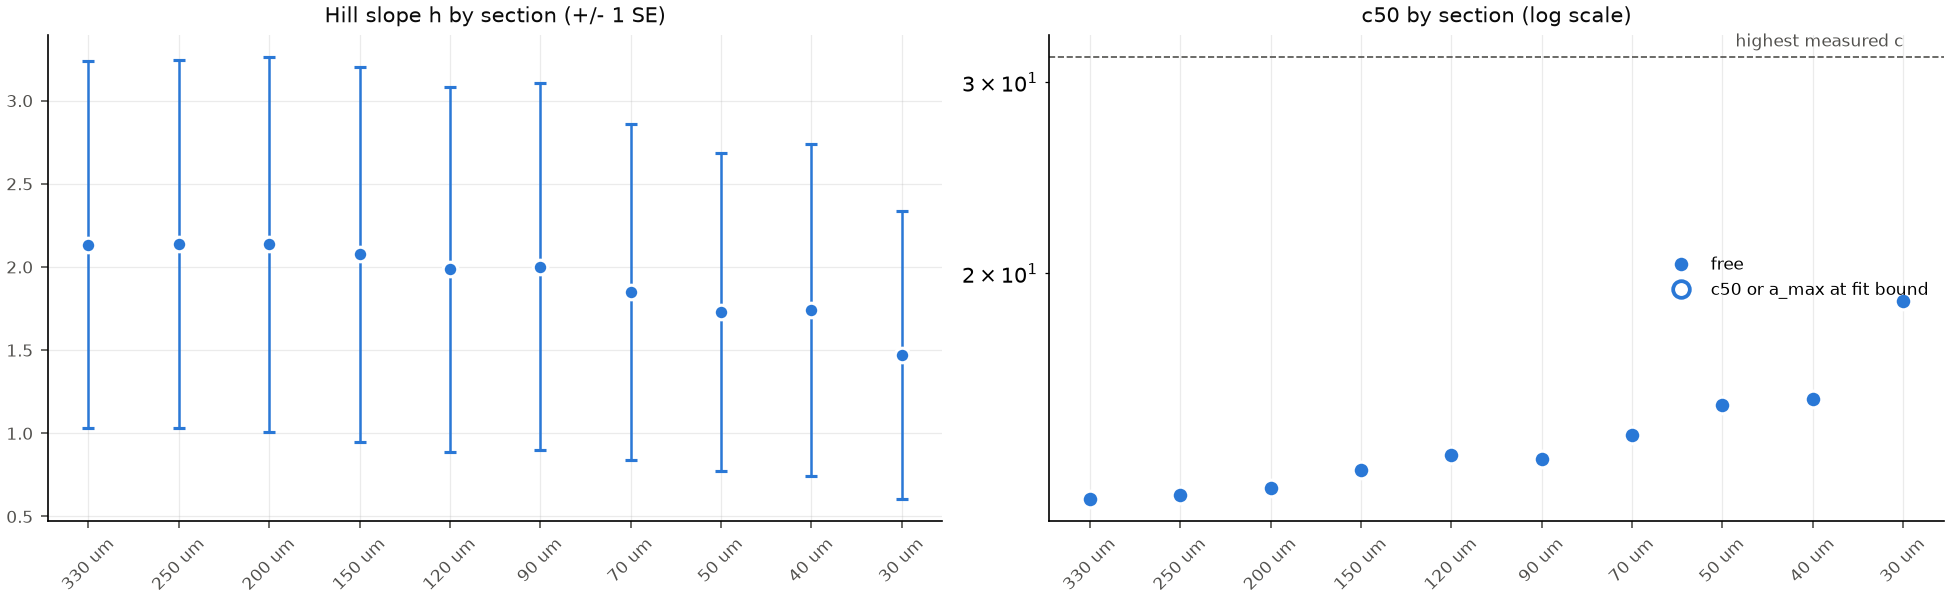
Each section is fit independently to all 21 sample points (replicates kept separate, 0 mM included, unweighted least squares). Standard errors come from the covariance matrix scaled by the residual variance.corr(c50,h) and corr(a_max,h) show how strongly the
parameters trade off: values near ±1 mean the data cannot pin them down separately,
which is expected when the upper plateau is not reached.
| section | a_min | a_max | c50 | h | SE a_min | SE a_max | SE c50 | SE h | corr(c50,h) | corr(a_max,h) | RMSE | at bound |
|---|---|---|---|---|---|---|---|---|---|---|---|---|
| 330 um | 0.137 | 0.4173 | 12.4049 | 2.1346 | 0.0236 | 0.0782 | 3.9029 | 1.1023 | -0.725 | -0.885 | 0.03329 | |
| 250 um | 0.1062 | 0.3399 | 12.4961 | 2.139 | 0.0196 | 0.0658 | 3.9585 | 1.1079 | -0.73 | -0.886 | 0.0277 | |
| 200 um | 0.0839 | 0.2793 | 12.687 | 2.1353 | 0.0165 | 0.0573 | 4.1713 | 1.1282 | -0.741 | -0.888 | 0.02333 | |
| 150 um | 0.0639 | 0.2252 | 13.168 | 2.0753 | 0.0135 | 0.0522 | 4.8327 | 1.1282 | -0.773 | -0.896 | 0.01896 | |
| 120 um | 0.0511 | 0.1892 | 13.6126 | 1.9869 | 0.0114 | 0.0491 | 5.6105 | 1.0975 | -0.8 | -0.903 | 0.01573 | |
| 90 um | 0.0381 | 0.1424 | 13.5023 | 2.003 | 0.0087 | 0.0363 | 5.4288 | 1.1017 | -0.794 | -0.902 | 0.01194 | |
| 70 um | 0.0305 | 0.1202 | 14.204 | 1.8491 | 0.0071 | 0.035 | 6.7249 | 1.0106 | -0.831 | -0.911 | 0.0094 | |
| 50 um | 0.0216 | 0.0896 | 15.1325 | 1.7309 | 0.0052 | 0.0301 | 8.4657 | 0.9546 | -0.86 | -0.919 | 0.0066 | |
| 40 um | 0.0164 | 0.0689 | 15.319 | 1.74 | 0.0041 | 0.0244 | 8.9517 | 0.9968 | -0.863 | -0.92 | 0.00527 | |
| 30 um | 0.0121 | 0.0583 | 18.8547 | 1.472 | 0.0031 | 0.03 | 17.1155 | 0.8645 | -0.912 | -0.933 | 0.0037 |
↑ topStep 5 — Residuals vs. time
Assuming all samples were mixed with urease at about the same moment (as on 10/02; not recorded for this run), time since mixing is the imaging time plus a constant. If the reaction were still progressing, residuals would trend upward with time. Residuals are normalized by each section's measured span (A at the top concentration minus A at 0 mM) so sections can be pooled. The right panel uses only the a/b/c replicates: each replicate's deviation from its group mean, averaged over sections, which is model-free.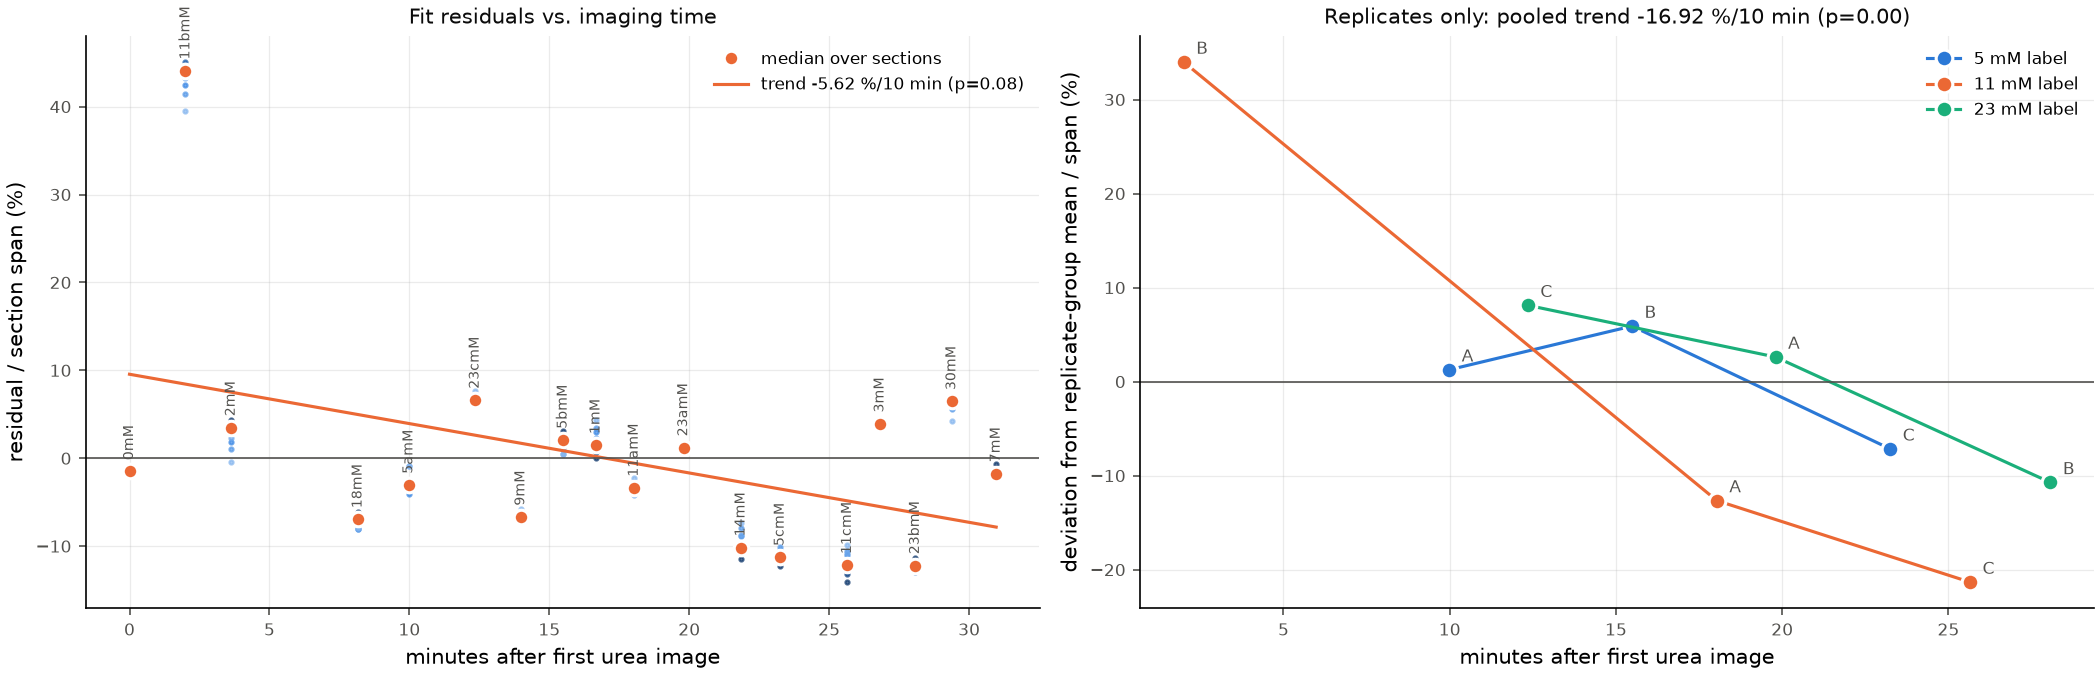
↑ topStep 6 — How well is h constrained?
Profile over h: for each fixed h, refit a_min, a_max, c50 and record the residual
sum of squares. The 95 % interval is where RSS / RSS_min stays below
1 + F(0.95; 1, n-4) / (n-4). A flat profile means the data do not determine h.
Fixed a_max: without an upper plateau, a_max is set mostly by extrapolation. Holding
a_max = A_0 + k (A_top - A_0) for several k shows how much h depends on that assumption.
Joint fit: shared c50 and h across the selected sections, with each section keeping
its own a_min and a_max. Thinner sections have lower absorbance and the most nearly
linear path-length response (Step 3).
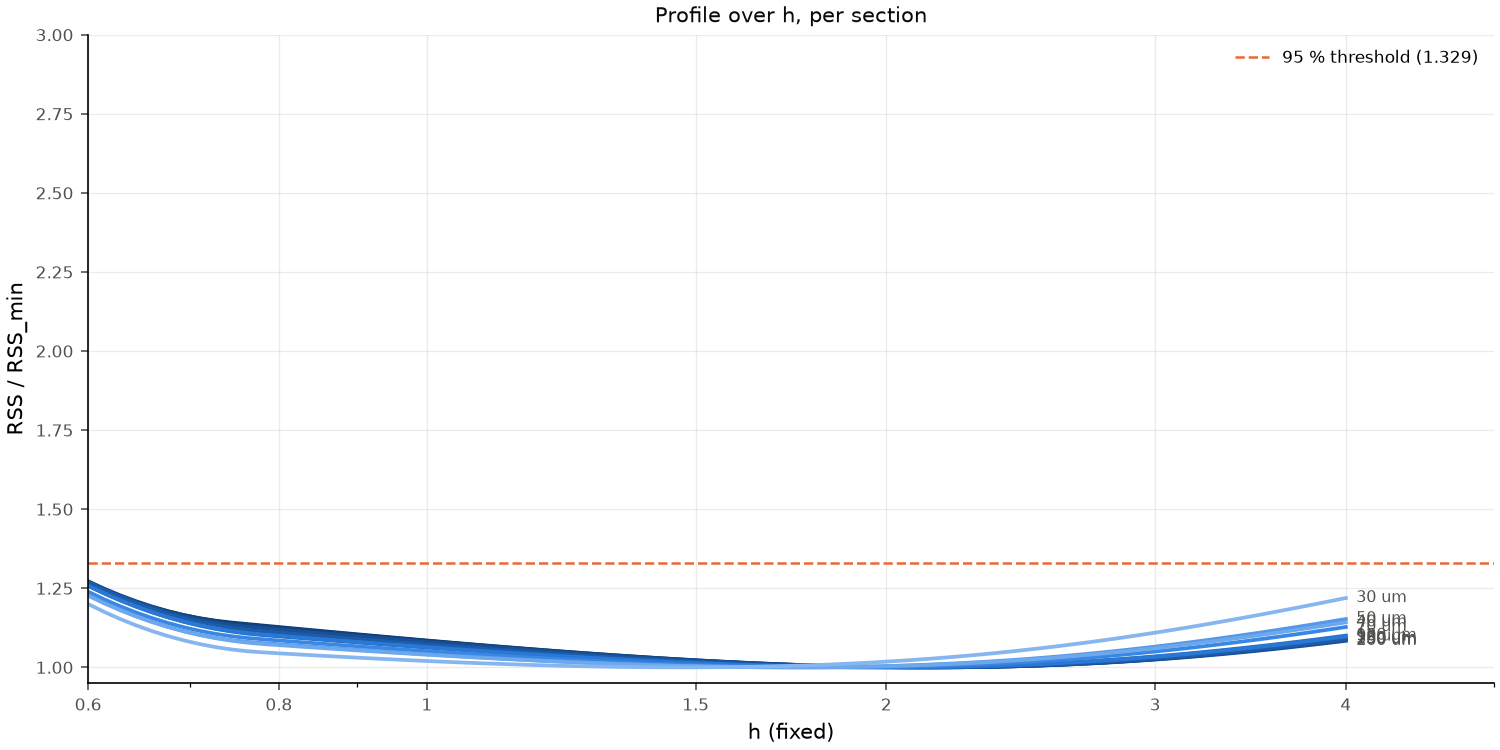
| section | h (free fit) | 95% CI low | 95% CI high | CI hits grid edge |
|---|---|---|---|---|
| 330 um | 2.135 | 0.6 | 4 | True |
| 250 um | 2.139 | 0.6 | 4 | True |
| 200 um | 2.135 | 0.6 | 4 | True |
| 150 um | 2.075 | 0.6 | 4 | True |
| 120 um | 1.987 | 0.6 | 4 | True |
| 90 um | 2.003 | 0.6 | 4 | True |
| 70 um | 1.849 | 0.6 | 4 | True |
| 50 um | 1.731 | 0.6 | 4 | True |
| 40 um | 1.74 | 0.6 | 4 | True |
| 30 um | 1.472 | 0.6 | 4 | True |
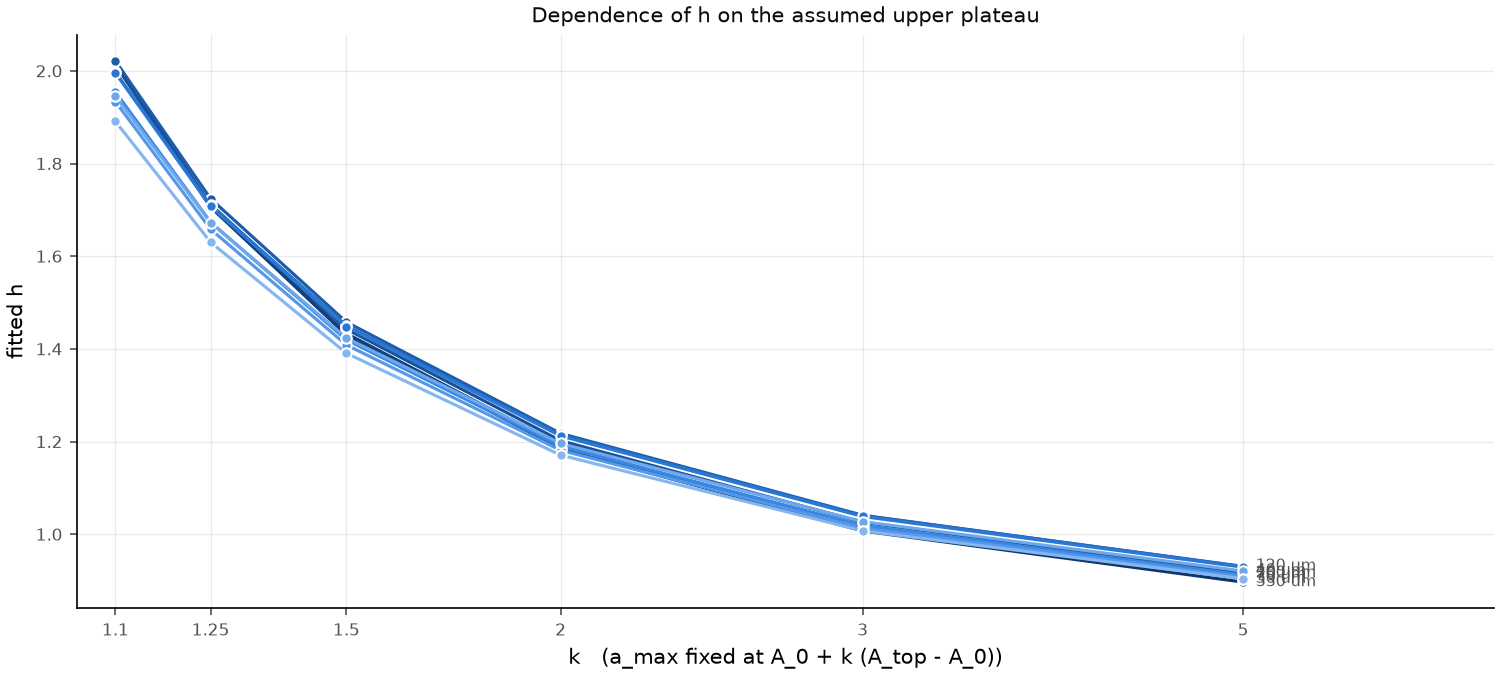
| section | h (k=1.1) | c50 (k=1.1) | h (k=1.25) | c50 (k=1.25) | h (k=1.5) | c50 (k=1.5) | h (k=2) | c50 (k=2) | h (k=3) | c50 (k=3) | h (k=5) | c50 (k=5) |
|---|---|---|---|---|---|---|---|---|---|---|---|---|
| 330 um | 2.02 | 12.9 | 1.71 | 15 | 1.43 | 19.3 | 1.18 | 29.7 | 1.01 | 57 | 0.9 | 131.3 |
| 250 um | 2.01 | 13 | 1.71 | 15.2 | 1.43 | 19.5 | 1.19 | 30 | 1.01 | 57.4 | 0.9 | 131 |
| 200 um | 2.01 | 13.2 | 1.71 | 15.5 | 1.44 | 19.8 | 1.2 | 30.3 | 1.03 | 57.5 | 0.92 | 129.8 |
| 150 um | 2.02 | 13.4 | 1.72 | 15.7 | 1.46 | 20 | 1.22 | 30.5 | 1.04 | 57.3 | 0.93 | 127.6 |
| 120 um | 2 | 13.6 | 1.71 | 15.8 | 1.45 | 20.2 | 1.21 | 30.8 | 1.04 | 57.9 | 0.93 | 128.8 |
| 90 um | 2 | 13.5 | 1.71 | 15.8 | 1.45 | 20.2 | 1.21 | 30.9 | 1.04 | 58 | 0.93 | 129.3 |
| 70 um | 1.95 | 13.5 | 1.67 | 15.8 | 1.42 | 20.3 | 1.19 | 31.3 | 1.02 | 59.6 | 0.91 | 134.7 |
| 50 um | 1.93 | 13.6 | 1.66 | 15.9 | 1.41 | 20.5 | 1.18 | 31.6 | 1.01 | 60.4 | 0.91 | 137.1 |
| 40 um | 1.95 | 13.7 | 1.67 | 16.1 | 1.42 | 20.6 | 1.2 | 31.6 | 1.03 | 59.8 | 0.92 | 134 |
| 30 um | 1.89 | 13.8 | 1.63 | 16.2 | 1.39 | 20.9 | 1.17 | 32.4 | 1.01 | 62.1 | 0.9 | 141.2 |
Sections in joint fit: 90um, 70um, 50um, 40um, 30um
| fit | sections | h | SE h | c50 (mM) | SE c50 | corr(c50,h) | RMSE |
|---|---|---|---|---|---|---|---|
| selected | 90 um, 70 um, 50 um, 40 um, 30 um | 1.866 | 0.437 | 14.21 | 2.84 | -0.829 | 0.00795 |
| all | 330 um, 250 um, 200 um, 150 um, 120 um, 90 um, 70 um, 50 um, 40 um, 30 um | 2.093 | 0.329 | 12.76 | 1.29 | -0.751 | 0.01829 |
↑ topStep 7 — Comparison with 10/02 (10 mM HEPES) and earlier runs
The 10/02 run used the same 546-10 filter, sample series, and analysis, so it isolates the buffer change (different device, so heights may differ by a few %). Its section absorbances are read from../2026-10-02_urea_and_allura_red/urea_calibration_546-10.json
and get the same mass-correction choice as this run (toggle above).
Earlier runs stored G = blank-subtracted absorbance referred to the 90 um section
(using Allura-derived relative heights). The comparable quantity here is
ΔA_90 = A_90(c) - A_90(0 mM). The 9/26 run used the 545-30 filter, so its absolute
values are not comparable, but its curve shape is. The right panel normalizes every
curve to its value at 20 mM (the highest concentration all runs share). 9/11 and 9/26
concentrations are as labeled.
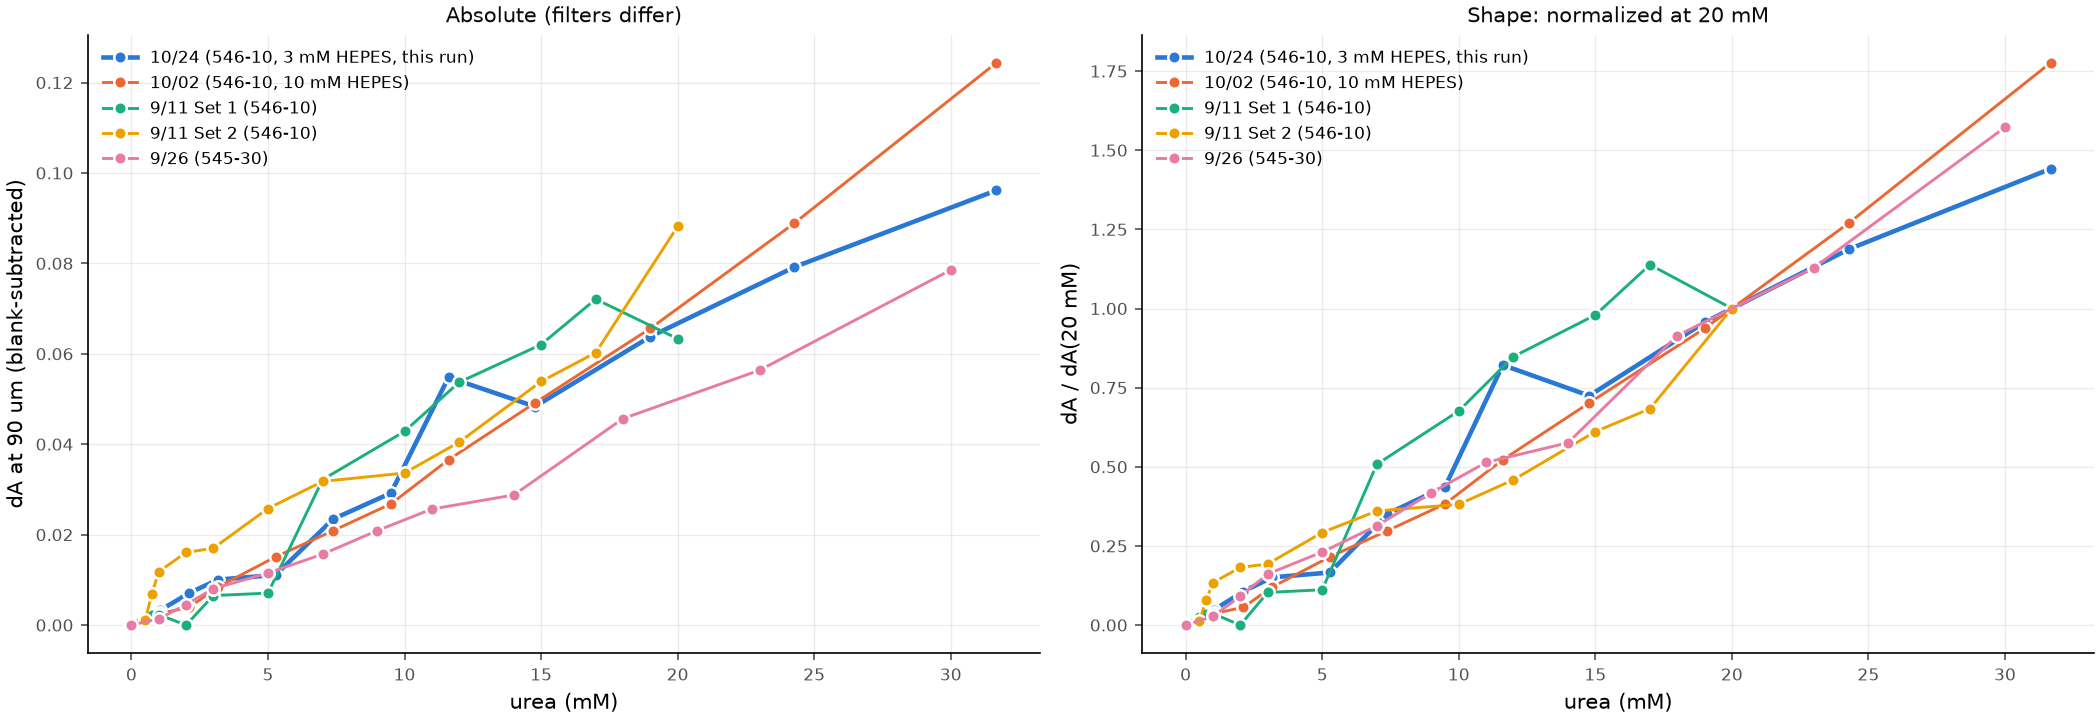
| run | c50 (mM) | h | note |
|---|---|---|---|
| 10/24 (546-10, 3 mM), 90 um free fit | 13.5 | 2.003 | per-section fit of A (not dA) |
| 10/24 (546-10, 3 mM), joint fit: selected | 14.21 | 1.866 | 90 um, 70 um, 50 um, 40 um, 30 um |
| 10/24 (546-10, 3 mM), joint fit: all | 12.76 | 2.093 | 330 um, 250 um, 200 um, 150 um, 120 um, 90 um, 70 um, 50 um, 40 um, 30 um |
| 10/02 (546-10, 10 mM), 90 um free fit | 1000 | 1.245 | as saved (mass-corrected conc.) |
| 10/02 (546-10, 10 mM), joint fit: selected | 1000 | 1.258 | 90 um, 70 um, 50 um, 40 um, 30 um |
| 10/02 (546-10, 10 mM), joint fit: all | 624.04 | 1.166 | 330 um, 250 um, 200 um, 150 um, 120 um, 90 um, 70 um, 50 um, 40 um, 30 um |
| 9/11 Set 1 (546-10) | 8.06 | 3.694 | |
| 9/11 Set 2 (546-10) | 229.83 | 1.029 | bounded fit (a_max<=1.0, c50<=500) - see divergence caveat above |
| 9/26 (545-30) | 1251.18 | 1.116 |
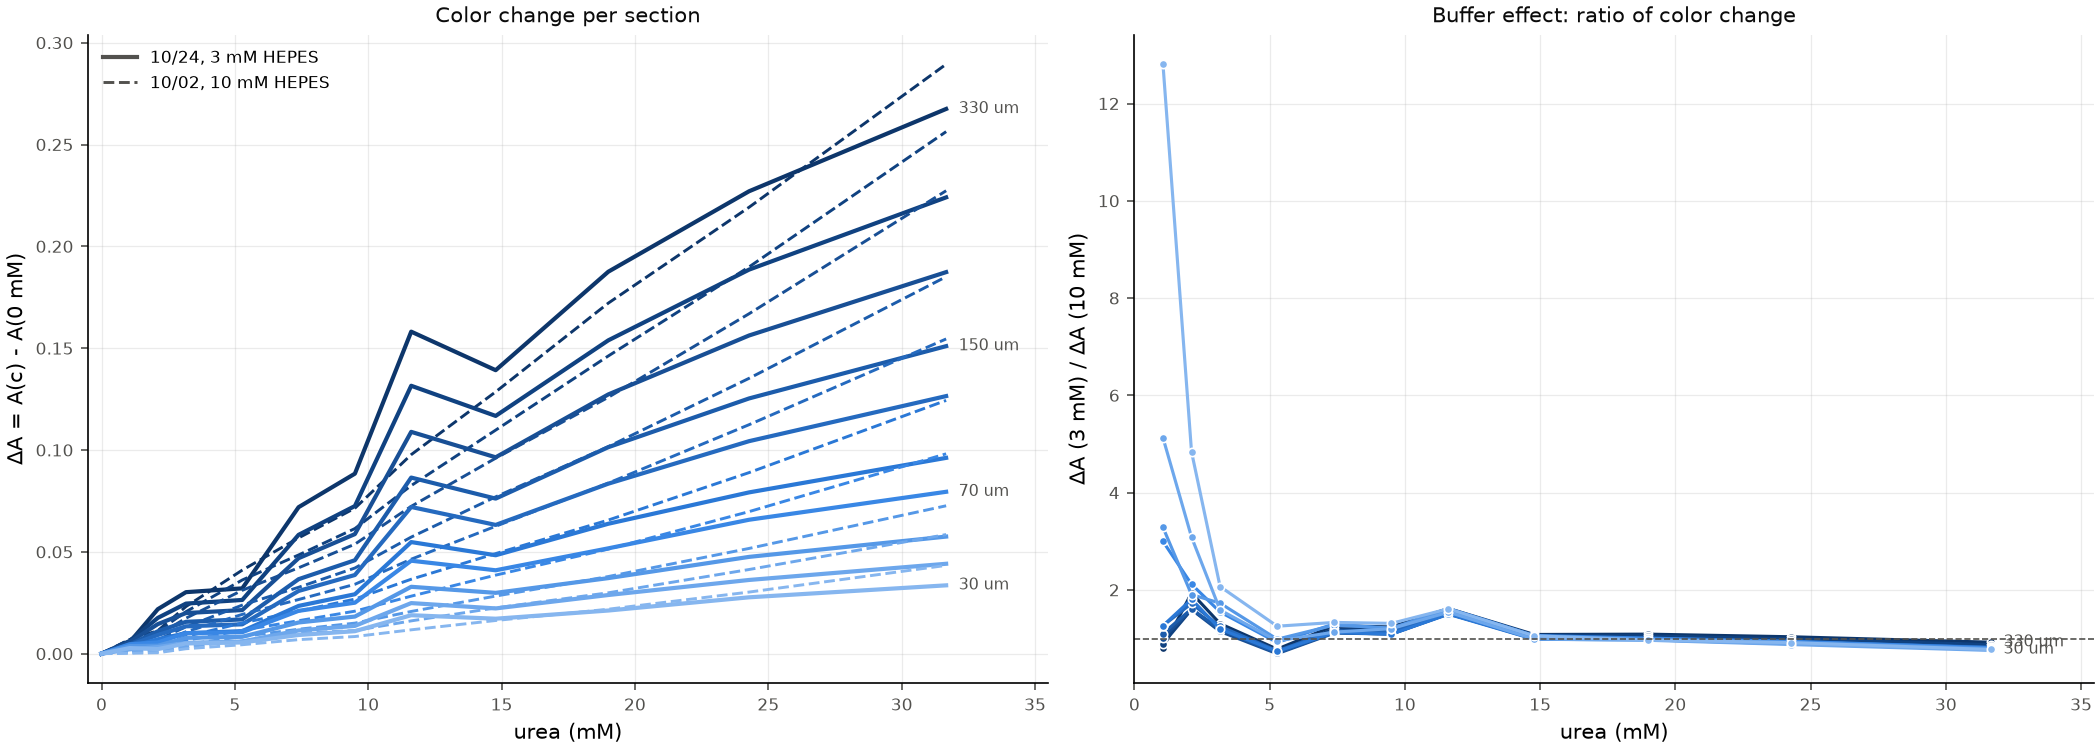
3 mM vs. 10 mM HEPES, section by section
MeanΔA = A(c) - A(0 mM) for every section, this run (solid) vs. 10/02 (dashed).
Ratio panel: ΔA_10/24 / ΔA_10/02 at the concentrations both runs share; a ratio
above 1 means the weaker buffer gives more color change per mM urea.
| section | 1.06 mM | 2.11 mM | 3.17 mM | 5.28 mM | 7.39 mM | 9.5 mM | 11.6 mM | 14.8 mM | 19 mM | 24.3 mM | 31.7 mM |
|---|---|---|---|---|---|---|---|---|---|---|---|
| 330 um | 0.81 | 1.936 | 1.305 | 0.782 | 1.265 | 1.237 | 1.618 | 1.083 | 1.09 | 1.036 | 0.924 |
| 250 um | 0.897 | 1.596 | 1.193 | 0.729 | 1.204 | 1.18 | 1.594 | 1.063 | 1.053 | 0.993 | 0.874 |
| 200 um | 1.009 | 1.595 | 1.145 | 0.688 | 1.112 | 1.092 | 1.506 | 1.005 | 1.011 | 0.936 | 0.824 |
| 150 um | 1.101 | 1.611 | 1.186 | 0.705 | 1.122 | 1.091 | 1.51 | 0.989 | 0.997 | 0.927 | 0.816 |
| 120 um | 1.263 | 1.72 | 1.249 | 0.747 | 1.158 | 1.134 | 1.553 | 1.011 | 0.996 | 0.928 | 0.818 |
| 90 um | 1.264 | 1.807 | 1.195 | 0.735 | 1.123 | 1.089 | 1.499 | 0.983 | 0.972 | 0.891 | 0.773 |
| 70 um | 2.997 | 2.116 | 1.545 | 0.919 | 1.299 | 1.199 | 1.616 | 1.062 | 1.008 | 0.943 | 0.81 |
| 50 um | 3.285 | 1.903 | 1.727 | 0.986 | 1.276 | 1.215 | 1.584 | 1.056 | 0.979 | 0.92 | 0.792 |
| 40 um | 5.129 | 3.085 | 1.586 | 0.951 | 1.131 | 1.202 | 1.542 | 0.989 | 0.964 | 0.876 | 0.755 |
| 30 um | 12.808 | 4.84 | 2.069 | 1.253 | 1.331 | 1.311 | 1.611 | 1.054 | 0.97 | 0.915 | 0.774 |
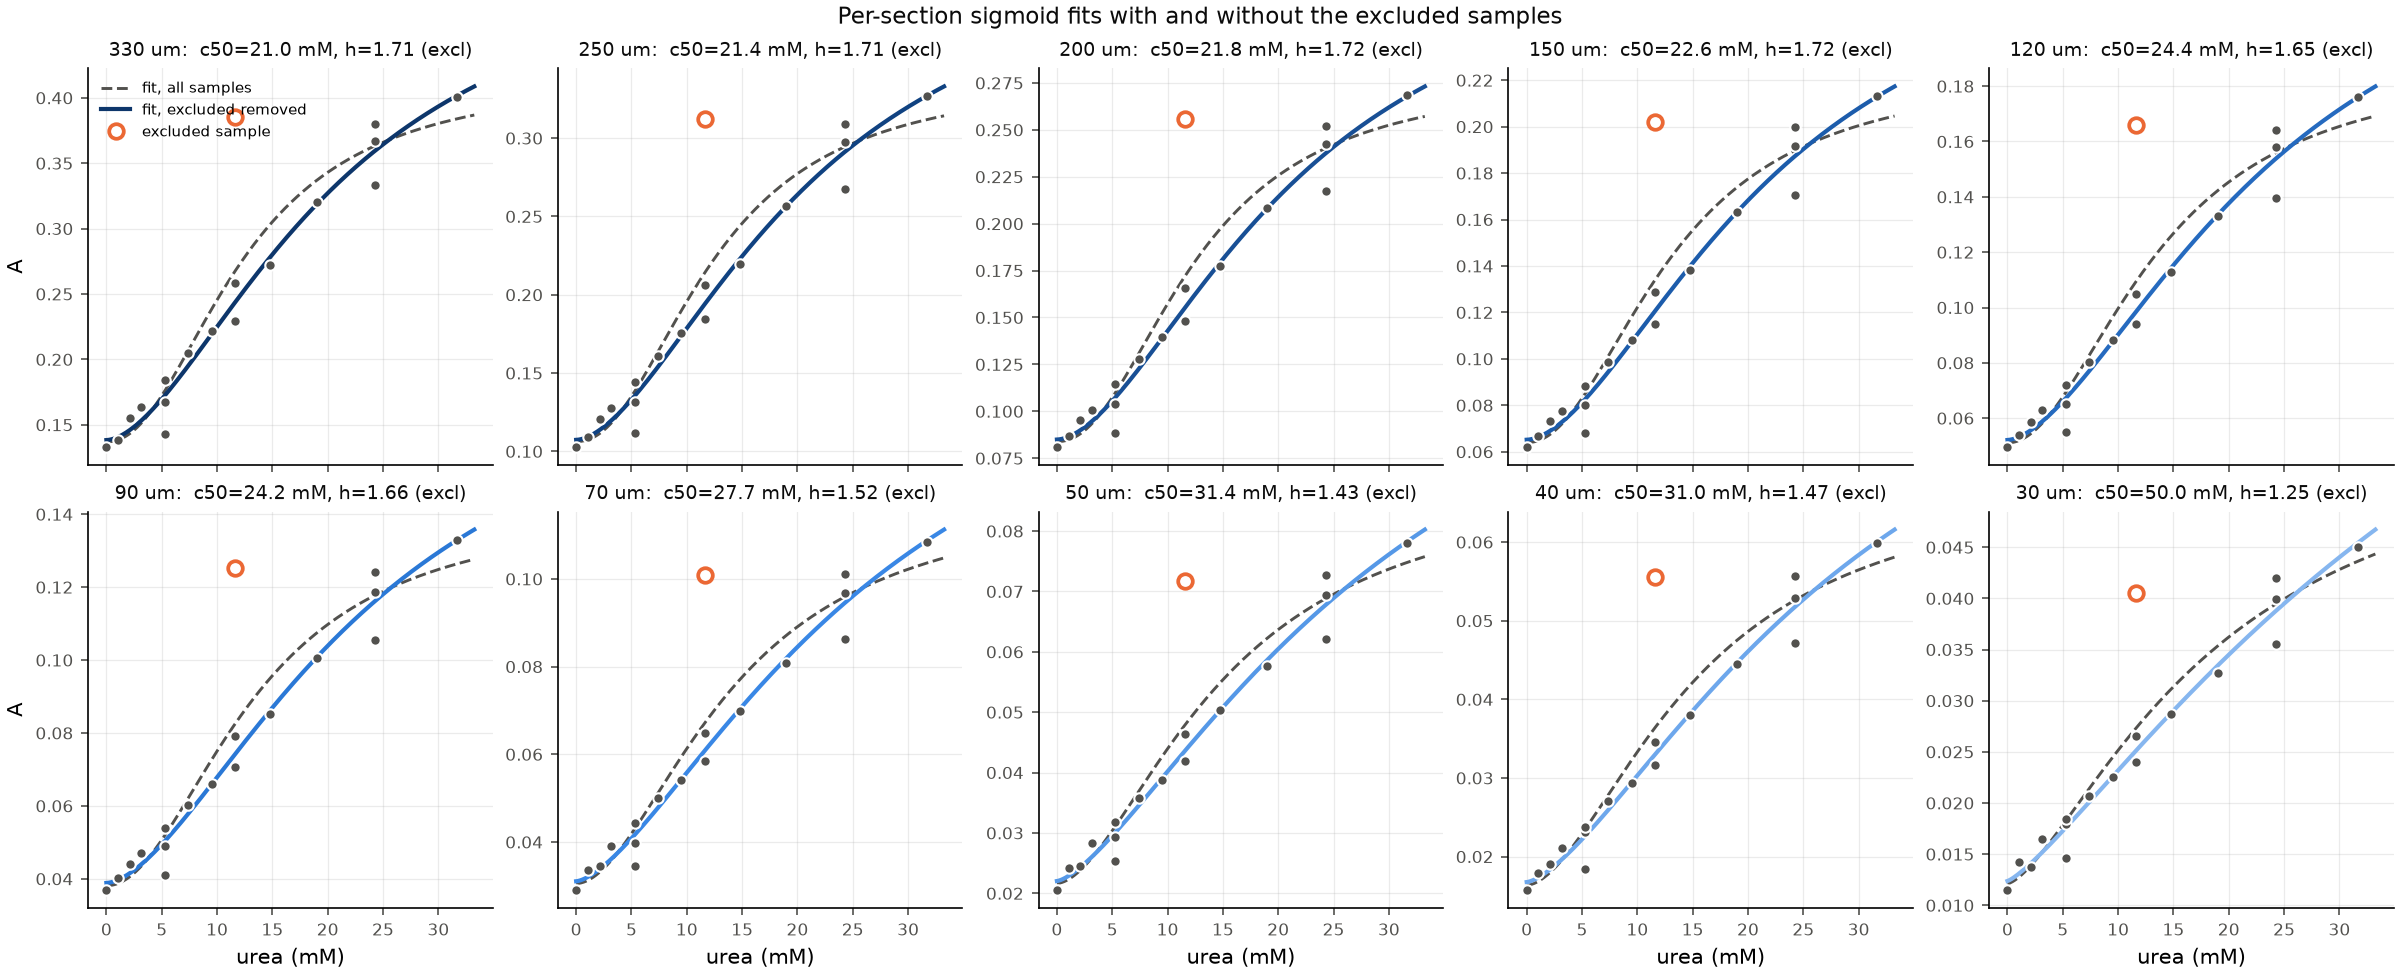
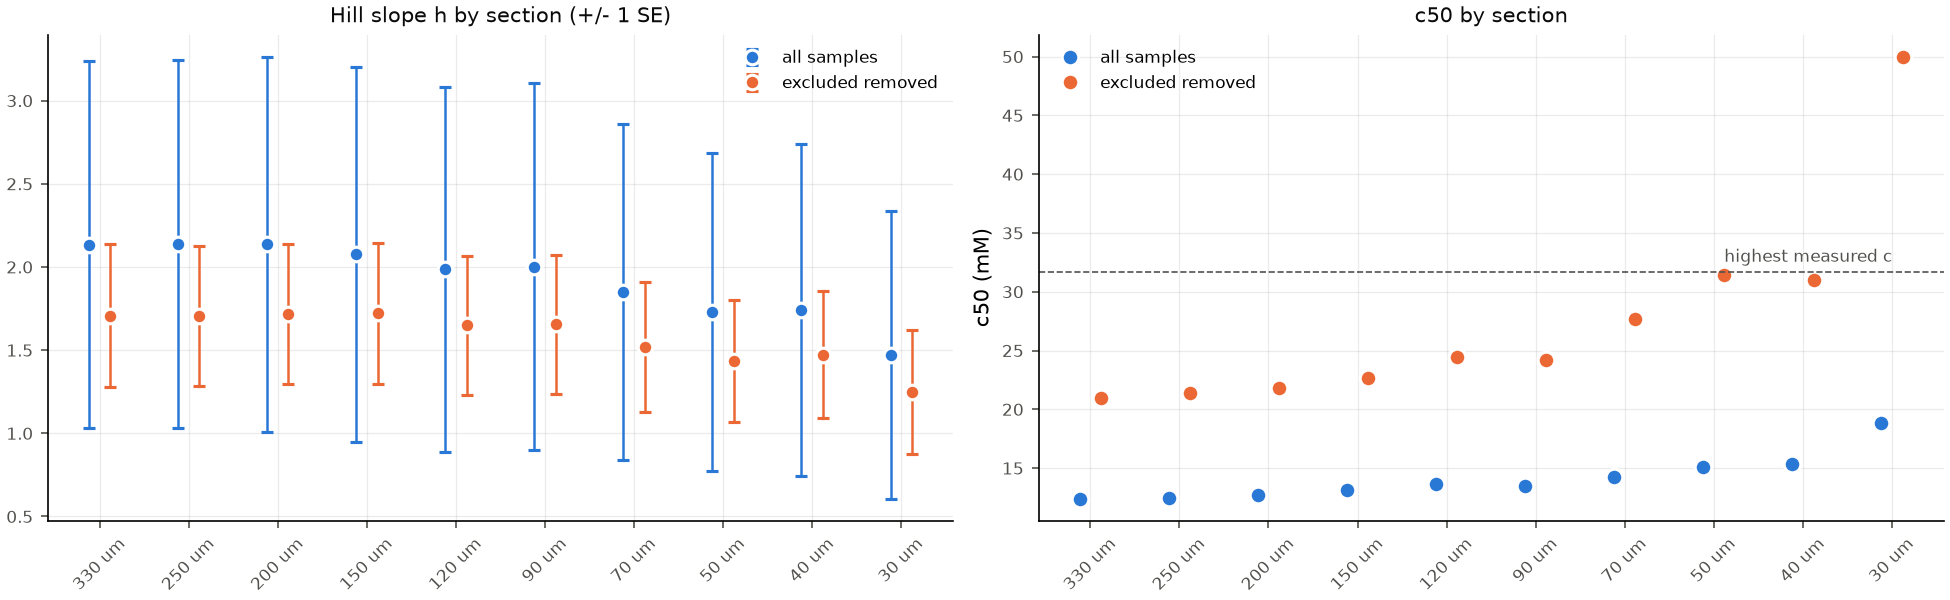
↑ topStep 8 — Sensitivity: refit without outlier samples
11b (imaged second, 2 min into the run) reads A ≈ 0.125 at 90 um, close to the 23 mM
level and far above 11a (0.079) and 11c (0.071). This section repeats the fits of
Steps 4–6 with the samples chosen below removed (default: 11bmM) and shows them next
to the all-sample results. Everything above this section still uses all samples.
Samples to exclude: 11bmM
Excluded: 11bmM (17 of 18 samples kept)| section | c50 all | c50 excl | h all | h excl | h 95% CI all | h 95% CI excl | a_max all | a_max excl | RMSE/span % all | RMSE/span % excl | at bound (excl) |
|---|---|---|---|---|---|---|---|---|---|---|---|
| 330 um | 12.4 | 20.96 | 2.135 | 1.708 | 0.60-4.00 | 0.88-2.79 | 0.417 | 0.532 | 12.4 | 4.9 | |
| 250 um | 12.5 | 21.37 | 2.139 | 1.707 | 0.60-4.00 | 0.90-2.79 | 0.34 | 0.439 | 12.4 | 4.8 | |
| 200 um | 12.69 | 21.82 | 2.135 | 1.72 | 0.60-4.00 | 0.90-2.79 | 0.279 | 0.364 | 12.5 | 4.7 | |
| 150 um | 13.17 | 22.64 | 2.075 | 1.721 | 0.60-4.00 | 0.92-2.79 | 0.225 | 0.296 | 12.6 | 4.7 | |
| 120 um | 13.61 | 24.45 | 1.987 | 1.651 | 0.60-4.00 | 0.90-2.72 | 0.189 | 0.257 | 12.4 | 4.7 | |
| 90 um | 13.5 | 24.19 | 2.003 | 1.656 | 0.60-4.00 | 0.88-2.72 | 0.142 | 0.193 | 12.4 | 4.7 | |
| 70 um | 14.2 | 27.69 | 1.849 | 1.517 | 0.60-4.00 | 0.86-2.53 | 0.12 | 0.172 | 11.8 | 4.6 | |
| 50 um | 15.13 | 31.41 | 1.731 | 1.434 | 0.60-4.00 | 0.84-2.36 | 0.09 | 0.134 | 11.5 | 4.4 | |
| 40 um | 15.32 | 31.03 | 1.74 | 1.472 | 0.60-4.00 | 0.86-2.47 | 0.069 | 0.102 | 11.9 | 4.5 | |
| 30 um | 18.85 | 49.98 | 1.472 | 1.248 | 0.60-4.00 | 0.80-2.25 | 0.058 | 0.104 | 11 | 4.6 |
Summary: all samples vs. excluded removed
| quantity | all samples | excluded removed | 10/02 (10 mM) |
|---|---|---|---|
| joint fit (selected): c50 (mM) | 14.21 | 27.08 | 1000 |
| joint fit (selected): h | 1.866 | 1.547 | 1.258 |
| joint fit (selected): RMSE | 0.00795 | 0.00305 | 0.00161 |
| joint fit (all): c50 (mM) | 12.76 | 22.05 | 624.04 |
| joint fit (all): h | 2.093 | 1.691 | 1.166 |
| joint fit (all): RMSE | 0.01829 | 0.00711 | 0.00326 |
| 90 um free fit: c50 | 13.502 | 24.186 | 1000 |
| 90 um free fit: h | 2.003 | 1.656 | 1.245 |
| trend of median residual (%/10 min) | -5.62 | -1.19 | |
| p | 0.077 | 0.379 | |
| replicate-only trend (%/10 min) | -16.92 | -8.62 | |
| p | 0.002 | 0.013 |
Saved:
urea_calibration_546-10.json