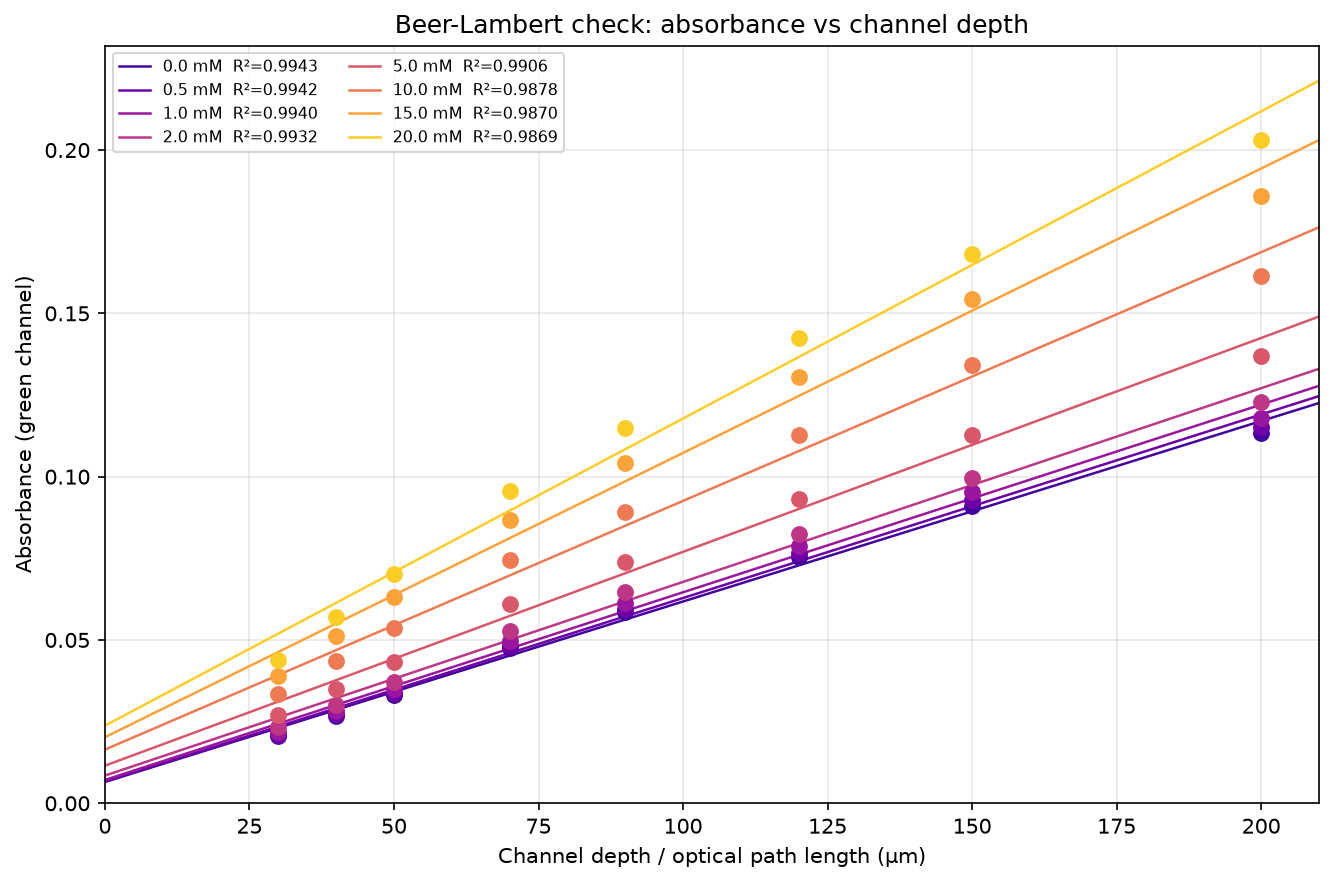
Compute absorbance from pre-processed corrected average transmittance images and quantify the colorimetric urea-urease assay response across 8 urea concentrations (0–20 mM). The observation channel has 8 sections of different optical path lengths (30–200 µm), enabling both a calibration curve and a Beer-Lambert validation within a single image.
Method: Green-channel absorbance, A = −log₁₀(T_green), using the green channel (most sensitive to Phenol Red at 559 nm within the TRITC filter passband ~530–590 nm). All 30 frames per concentration are averaged before computing absorbance.
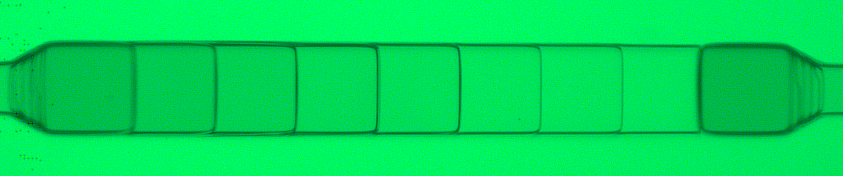
The image below shows a representative raw frame from the 0 mM urea TRITC dataset (cropped, 2× downsampled). The observation channel runs horizontally; the 8 stepped-height sections appear from left-to-right getting successively lighter with channel heights of 200, 150, 120, 90, 70, 50, 40, and 30 μm.
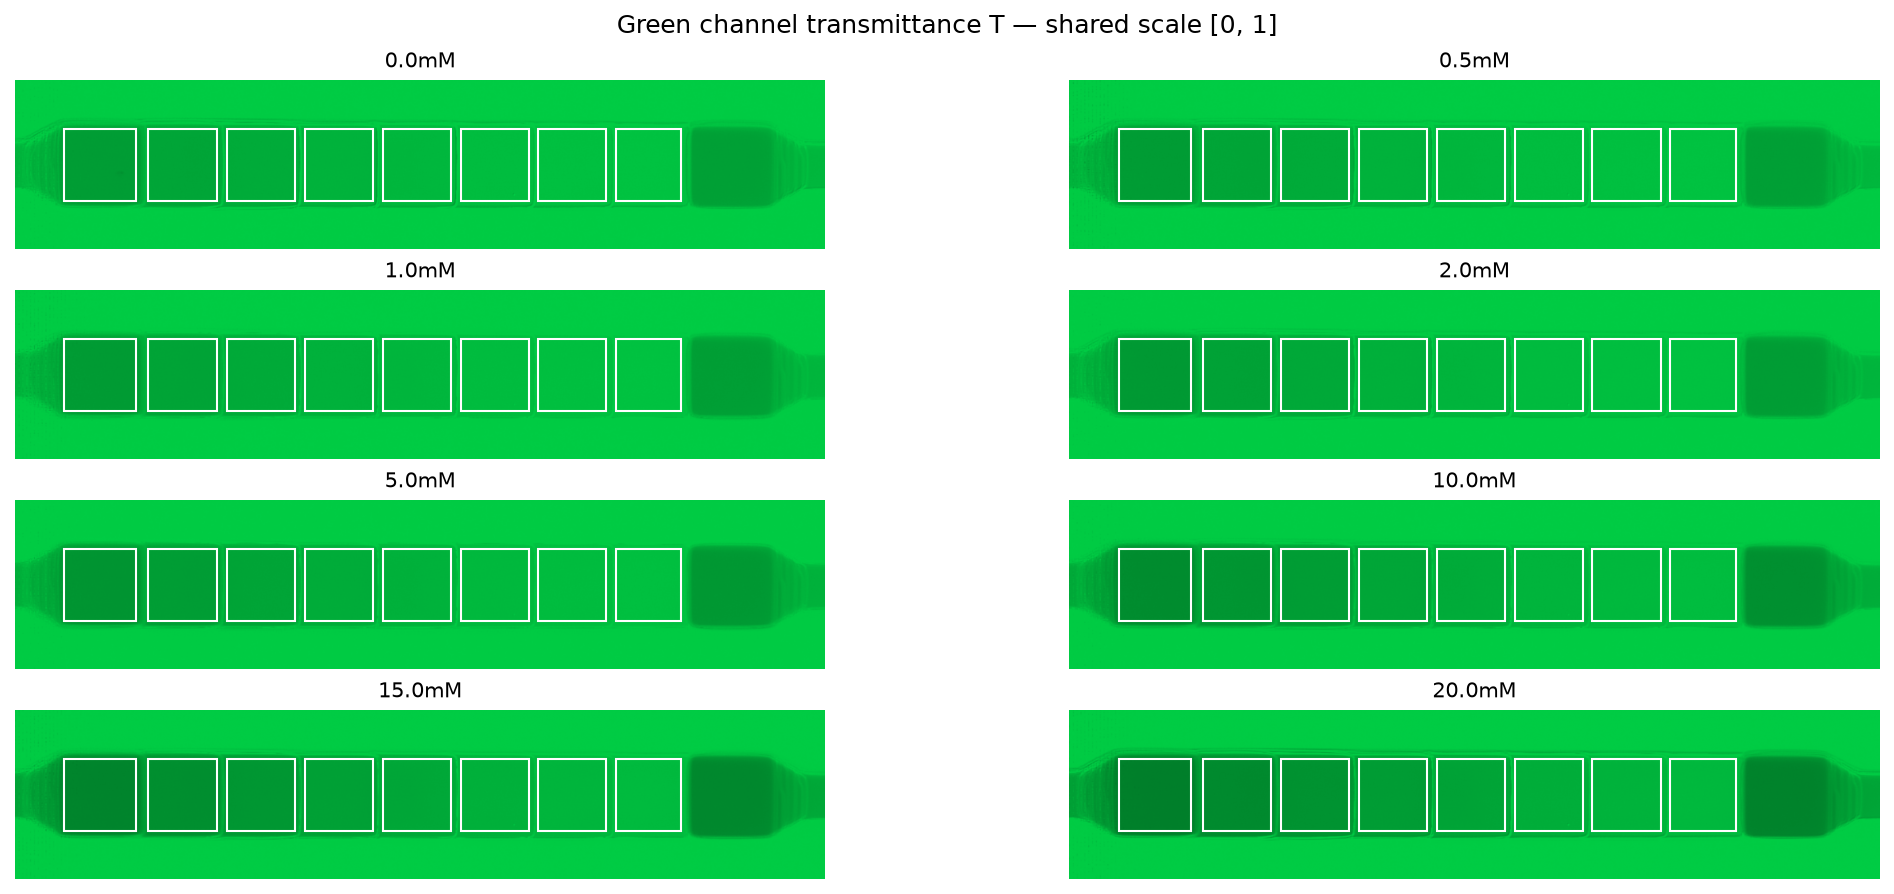
T images are stored as uint16 with T_actual = pixel / 65535. The green channel absorbance is A = −log₁₀(T_green), clipping T to a minimum of 1×10⁻⁶ to avoid undefined values.
Green channel transmittance for each concentration, displayed on a shared [0, 1] scale. Lower values (darker) indicate greater absorption by Phenol Red at 559 nm. Section ROI boxes are overlaid.
Mean absorbance in each of the 8 section ROIs at every concentration.
| Concentration (mM) | S1 | S2 | S3 | S4 | S5 | S6 | S7 | S8 |
|---|---|---|---|---|---|---|---|---|
| 0.0 | 0.1134 | 0.0911 | 0.0753 | 0.0586 | 0.0474 | 0.0332 | 0.0268 | 0.0207 |
| 0.5 | 0.1153 | 0.0928 | 0.0766 | 0.0596 | 0.0482 | 0.0338 | 0.0273 | 0.0210 |
| 1.0 | 0.1181 | 0.0953 | 0.0787 | 0.0614 | 0.0497 | 0.0349 | 0.0282 | 0.0217 |
| 2.0 | 0.1228 | 0.0996 | 0.0824 | 0.0647 | 0.0526 | 0.0371 | 0.0301 | 0.0233 |
| 5.0 | 0.1368 | 0.1128 | 0.0933 | 0.0739 | 0.0609 | 0.0432 | 0.0351 | 0.0272 |
| 10.0 | 0.1613 | 0.1342 | 0.1127 | 0.0893 | 0.0744 | 0.0537 | 0.0435 | 0.0336 |
| 15.0 | 0.1859 | 0.1543 | 0.1305 | 0.1041 | 0.0866 | 0.0632 | 0.0511 | 0.0391 |
| 20.0 | 0.2030 | 0.1682 | 0.1424 | 0.1150 | 0.0957 | 0.0702 | 0.0571 | 0.0439 |
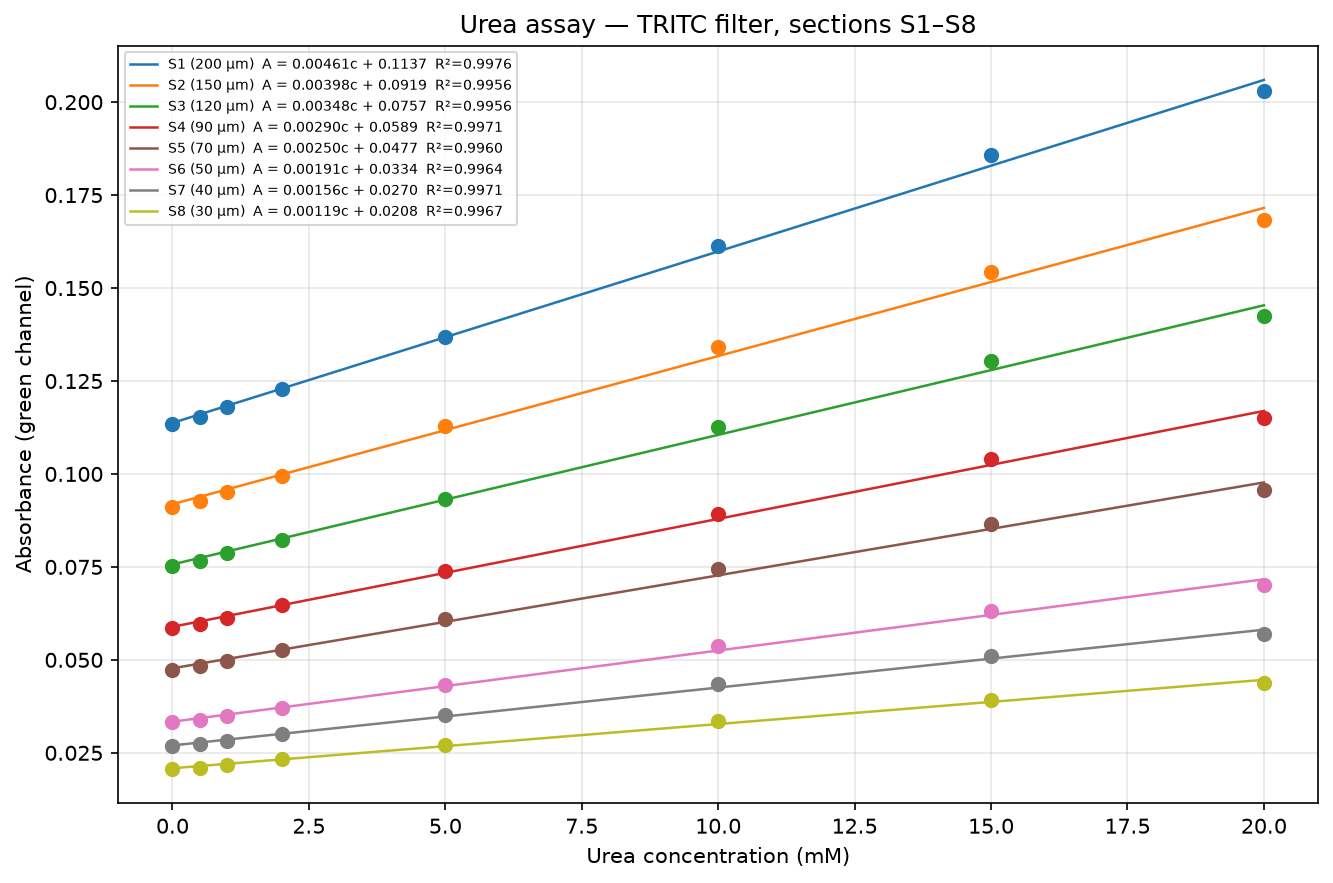
Linear fit (absorbance vs urea concentration) for each section. Deeper sections show steeper slopes as predicted by Beer-Lambert law (A ∝ depth × concentration).
| Section | Depth (µm) | Equation | R² |
|---|---|---|---|
| S1 | 200 | A = 0.00461·c + 0.1137 | 0.99756 |
| S2 | 150 | A = 0.00398·c + 0.0919 | 0.99563 |
| S3 | 120 | A = 0.00348·c + 0.0757 | 0.99560 |
| S4 | 90 | A = 0.00290·c + 0.0589 | 0.99715 |
| S5 | 70 | A = 0.00250·c + 0.0477 | 0.99600 |
| S6 | 50 | A = 0.00191·c + 0.0334 | 0.99644 |
| S7 | 40 | A = 0.00156·c + 0.0270 | 0.99708 |
| S8 | 30 | A = 0.00119·c + 0.0208 | 0.99673 |
Absorbance vs channel depth (optical path length, 30–200 µm) at each urea concentration. A linear relationship confirms Beer-Lambert behaviour: A = ε·c·l.