Dataset: 2026-06-26 TRITC on-chip urea assay (TRITC bandpass filter ~530–590 nm, 4× objective + 1.5× zoom, 0.987 µm/px). Cropped images: 352 × 1686 px. Green-channel absorbance A = −log₁₀(T).
This report compares absorbance results computed from a single frame (middle frame of 30) versus a 30-frame average for each concentration, dark image, and flat-field image. The goal is to determine whether the 30-frame average provides a meaningful improvement over using a single frame.
Solid circles and lines: 30-frame average. Dashed lines and triangles: single frame. One curve per channel section (S1–S8); deeper sections have steeper slopes.
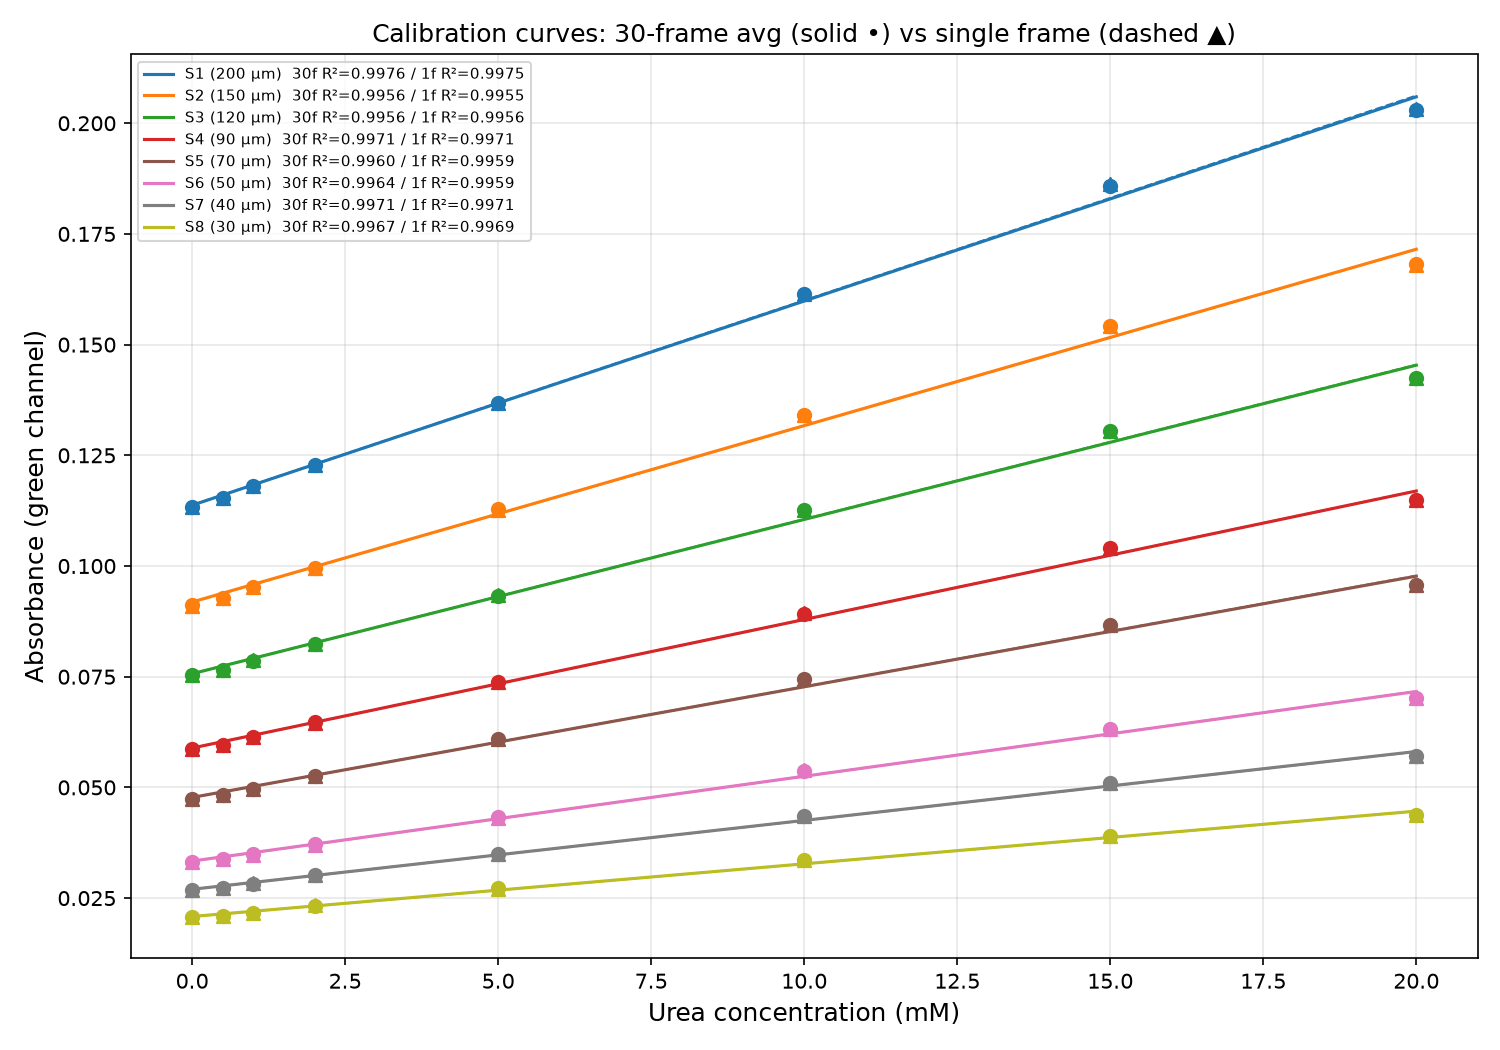
Figure 1. Calibration curves for both methods. Fits are nearly identical; R² values agree to ≥ 3 decimal places across all sections.
| Section | Depth (µm) | Equation (30f) | R² (30f) | Equation (1f) | R² (1f) | Slope Δ% |
|---|---|---|---|---|---|---|
| S1 | 200 | A = 0.00461·c + 0.1137 | 0.99756 | A = 0.00462·c + 0.1138 | 0.99752 | 0.27 |
| S2 | 150 | A = 0.00398·c + 0.0919 | 0.99562 | A = 0.00398·c + 0.0918 | 0.99550 | 0.02 |
| S3 | 120 | A = 0.00348·c + 0.0757 | 0.99560 | A = 0.00349·c + 0.0757 | 0.99563 | 0.11 |
| S4 | 90 | A = 0.00290·c + 0.0589 | 0.99714 | A = 0.00290·c + 0.0589 | 0.99715 | 0.06 |
| S5 | 70 | A = 0.00250·c + 0.0477 | 0.99600 | A = 0.00250·c + 0.0477 | 0.99590 | 0.20 |
| S6 | 50 | A = 0.00191·c + 0.0334 | 0.99644 | A = 0.00192·c + 0.0333 | 0.99592 | 0.24 |
| S7 | 40 | A = 0.00156·c + 0.0270 | 0.99707 | A = 0.00155·c + 0.0270 | 0.99709 | -0.16 |
| S8 | 30 | A = 0.00119·c + 0.0208 | 0.99670 | A = 0.00119·c + 0.0208 | 0.99685 | 0.05 |
Table 1. Linear fit equations and R² for both methods. Slope differences are ≤ 0.3% in all sections.
| Section | S1 | S2 | S3 | S4 | S5 | S6 | S7 | S8 |
|---|---|---|---|---|---|---|---|---|
| Concentration (mM) | ||||||||
| 0.0 | 0.00007 | -0.00011 | 0.00008 | 0.00002 | -0.00004 | 0.00003 | -0.00007 | 0.00007 |
| 0.5 | 0.00013 | 0.00004 | -0.00000 | -0.00003 | -0.00004 | -0.00003 | 0.00000 | -0.00004 |
| 1.0 | -0.00007 | -0.00006 | 0.00002 | -0.00001 | -0.00002 | -0.00015 | 0.00007 | -0.00005 |
| 2.0 | 0.00005 | -0.00007 | -0.00001 | -0.00005 | 0.00000 | -0.00007 | 0.00000 | 0.00004 |
| 5.0 | 0.00009 | -0.00008 | 0.00012 | 0.00001 | 0.00008 | -0.00011 | -0.00000 | -0.00010 |
| 10.0 | 0.00002 | 0.00001 | 0.00004 | 0.00006 | 0.00010 | 0.00016 | 0.00001 | -0.00006 |
| 15.0 | 0.00035 | 0.00002 | 0.00008 | -0.00002 | 0.00001 | 0.00007 | -0.00007 | 0.00004 |
| 20.0 | 0.00025 | -0.00009 | 0.00011 | 0.00003 | 0.00008 | -0.00005 | -0.00003 | 0.00001 |
Table 2. Absolute difference in mean ROI absorbance (AU). Maximum difference across all sections and concentrations: 0.00035 AU.
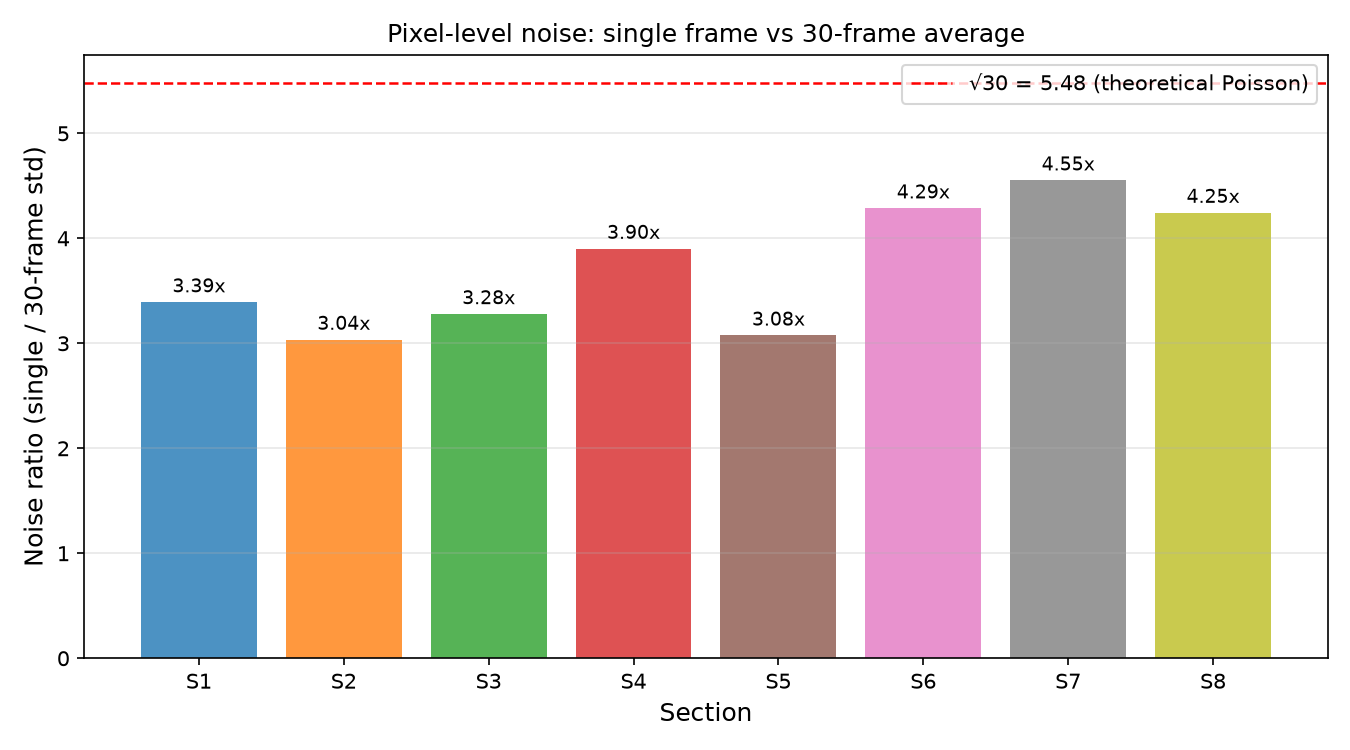
Figure 2. Ratio of pixel-level standard deviation (single frame / 30-frame average) within each section ROI, averaged across all concentrations. The red dashed line shows the theoretical √30 ≈ 5.48× expected for Poisson-limited noise. Observed ratios of 3–4.5× indicate the camera noise is sub-Poisson or partially correlated.
| Section | Std dev (30f) | Std dev (1f) | Noise ratio (1f/30f) |
|---|---|---|---|
| S1 | 0.0028 | 0.0097 | 3.3929 |
| S2 | 0.0023 | 0.0069 | 3.0361 |
| S3 | 0.0021 | 0.0068 | 3.2799 |
| S4 | 0.0018 | 0.0070 | 3.9025 |
| S5 | 0.0024 | 0.0072 | 3.0762 |
| S6 | 0.0017 | 0.0072 | 4.2873 |
| S7 | 0.0016 | 0.0073 | 4.5537 |
| S8 | 0.0018 | 0.0074 | 4.2452 |
Table 3. Mean pixel standard deviation and noise ratio per section.